


Fast dashboarding was the brief today. Great to working again with simple, clean data, but the time pressure and the need to bring relevant KPI information to the forefront has made this day challenging like day other in dashboard week so far.
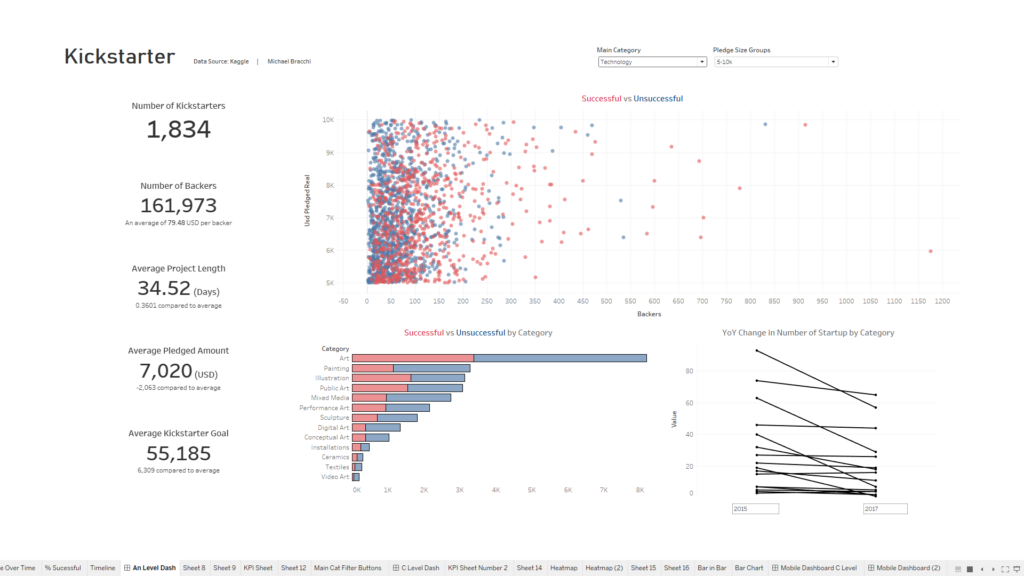
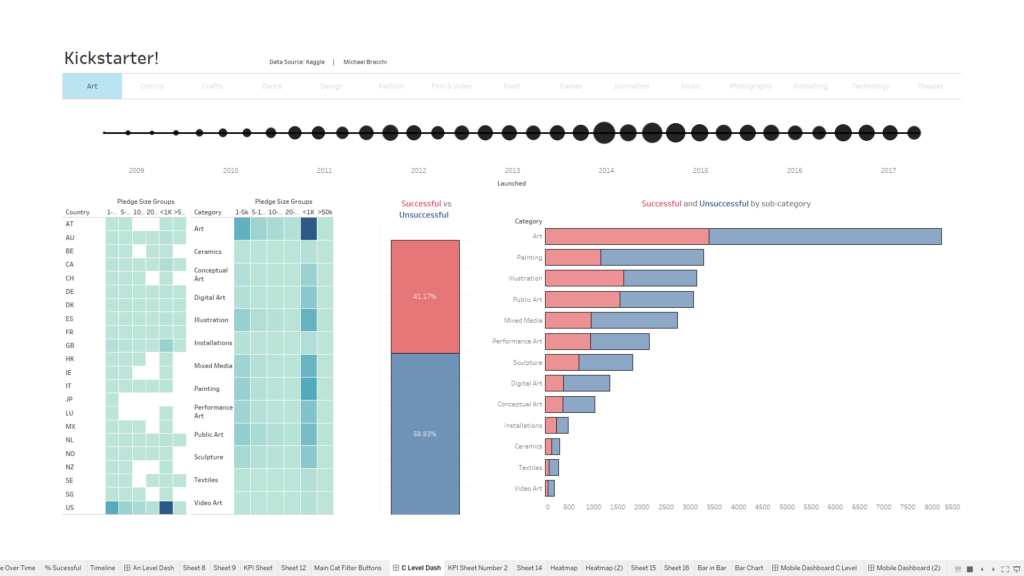
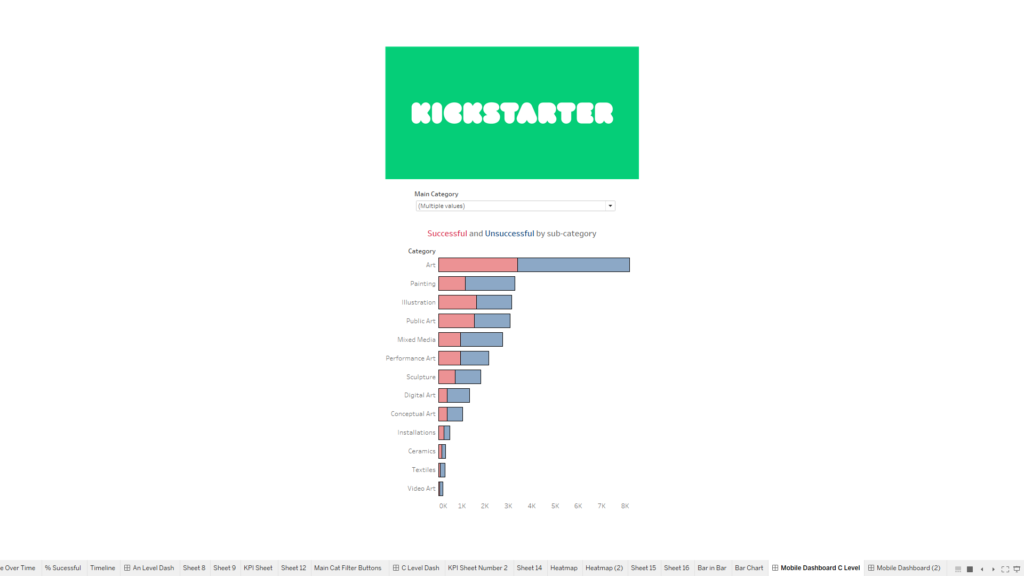
I ended up with four dashboards, as per the task, 2 KPI dashboards and 2 mobile dashboards.
See the blog from Coach Kriebel:
The key lessons learnt from today:
I sketched:
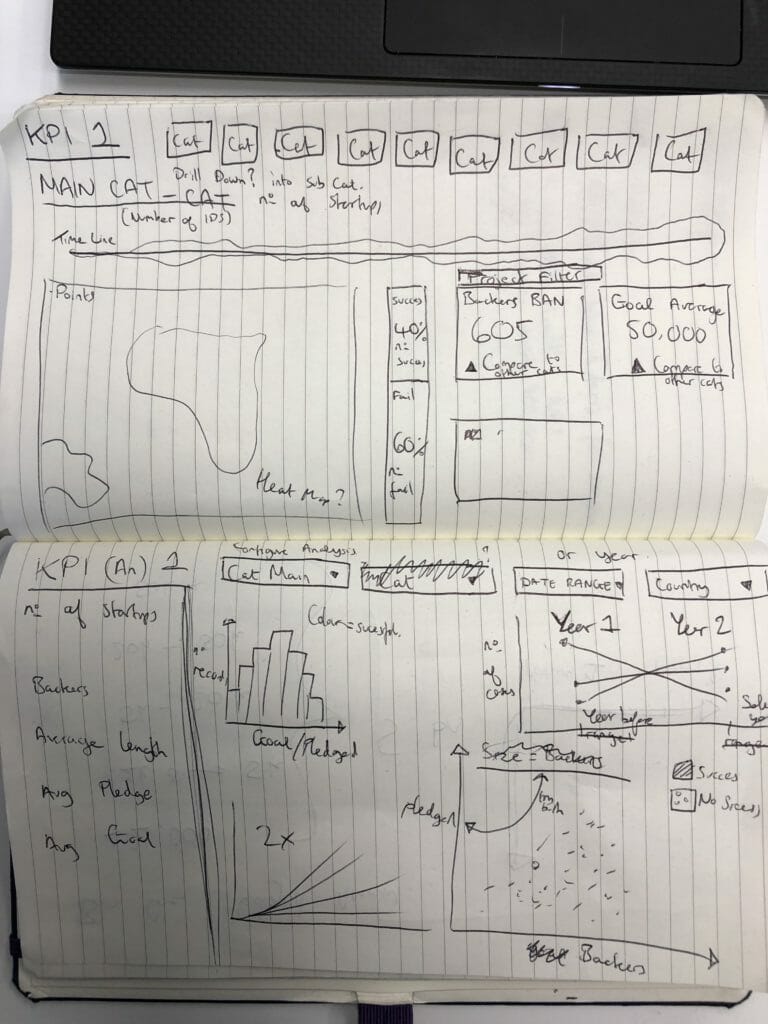
The sketching came in handy today, giving me a sense of direction. Some of it was chopped out, and there certainly wasn’t enough time to fully complete and format the sketched viz idea at the other end. The viz’s suffer a little from lack of formatting, some of the KPIs/BANs could be made easier on the eye for sure, however most of the relevant information is there, i think.
Also, with some charts, it seems worthwhile checking if the idea is valid, particular comparing measure to measure in a scatter. A quick bit of a charting can tell you this straight away usually, but there also may be ways of grouping the data or focusing in on portions of the data to gain some resolution when using a scatter. This takes time to gauge and is worth trying to build a quick scatter to quickly get a feel for the spread of your data.
Dashboards:
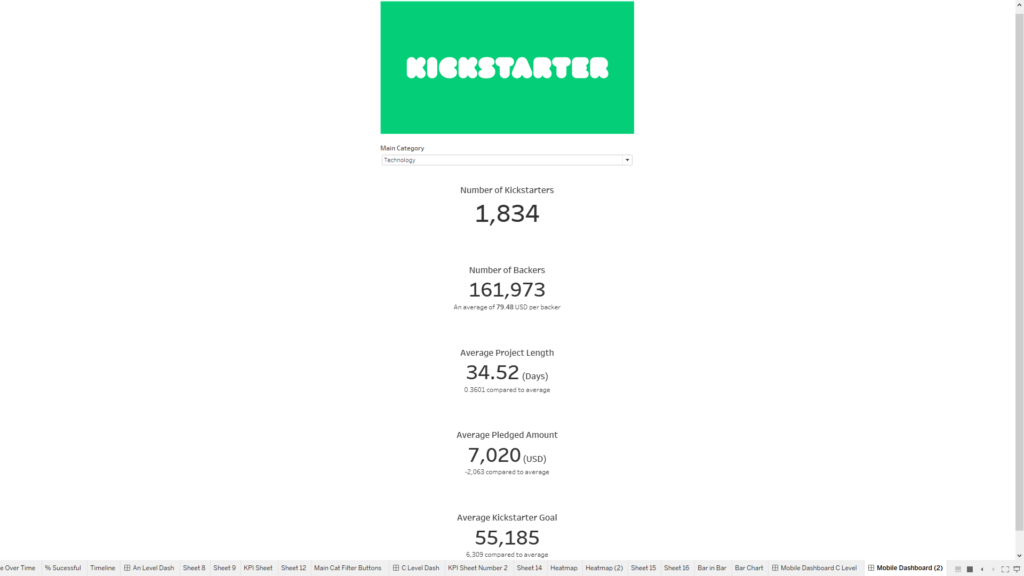
https://public.tableau.com/profile/michael.bracchi#!/vizhome/MobileDashboard_AnalystLevel_/MobileDashboard2?publish=yes
Clearly there is almost no formatting happening with the dashboards and i’m not 100% happy with the cohesiveness of the dashboard. Particularly the scatter. Could have probably visualised the data in another day; a challenge for another day!
Another great day as part of dashboard week!