


Final day, final viz, final blog!
Andy must have been in an extra pleasant mood as he saved us the pain of doing any Alteryx for this challenge, that alleviated the pressure somewhat.
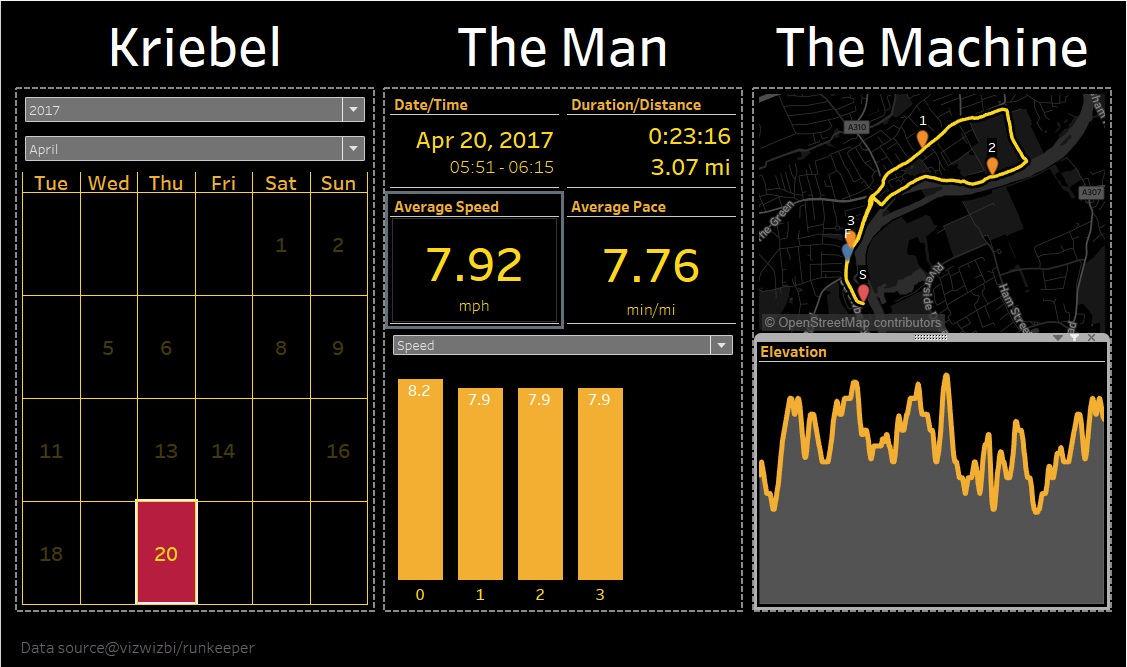
This final challenge was to look at run training data collected by Runkeeper.
To be honest, my brain was exhausted from the previous 3 challenges and whilst I was giving this dashboard maximum effort, that effort was only a fraction of what I normally give and so the original results were sub par, at best!
For some reason on reading the challenge, I immediately thought of the 1987 classic film: The Running Man and that’s where my research began;
 ]
]
There weren’t many challenges to creating this viz, Andy had prepped the data and everything seemed pretty straight forward. The only head scratcher was the distance calculation, Andy had said that the measurements were in meters, when in fact they were in miles;
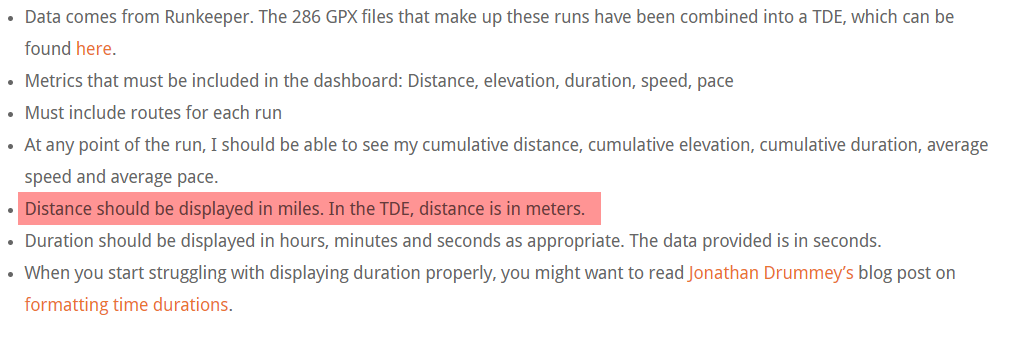
But that was quickly resolved with a slight modification to a calculation or two.
And here was the result;

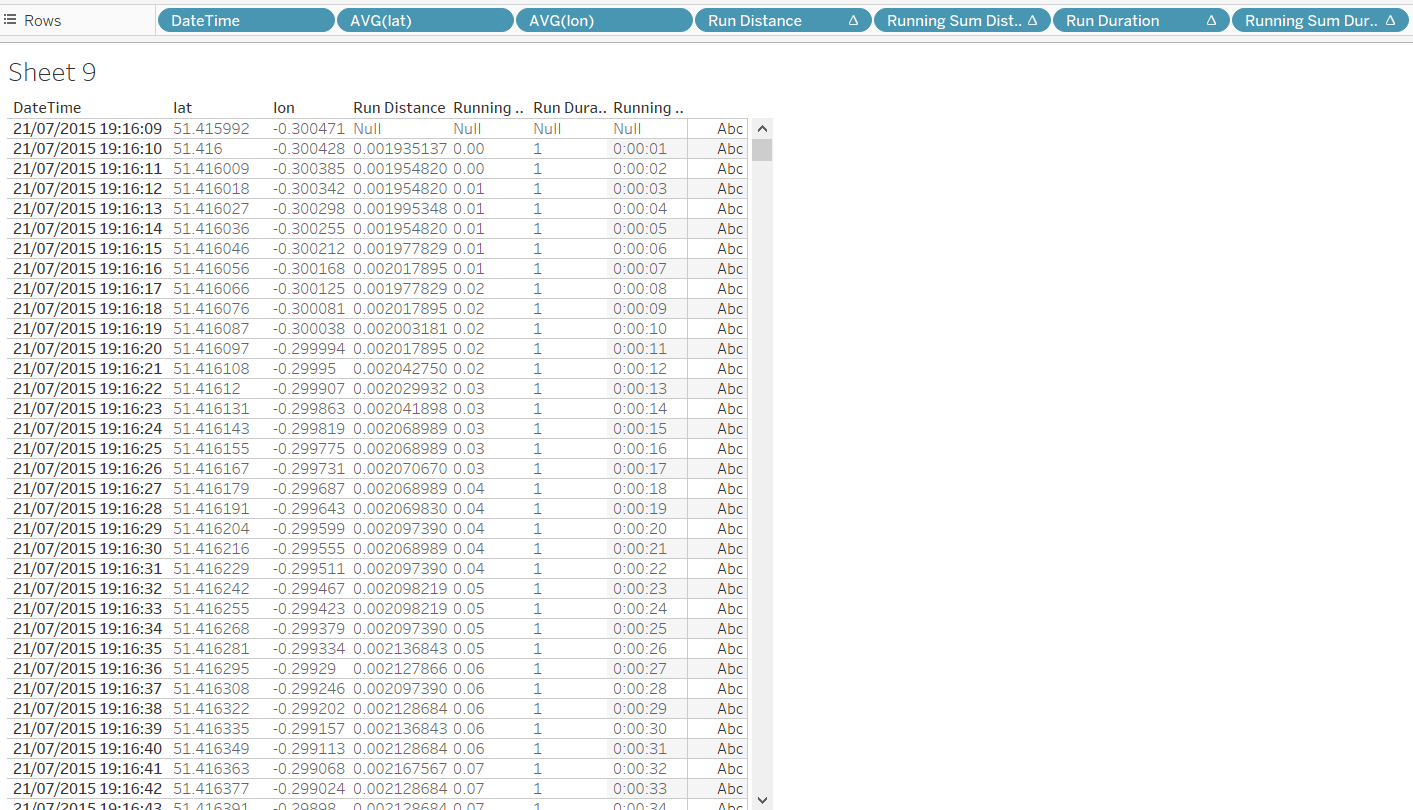
But the next day (Saturday, my birthday) I kept thinking about this viz and how disappointed I was with the final result. So I pondered it a bit further and decided to rebuild it again from scratch, with one change, I wanted to see if it was possible to build the entire thing just using Latitude, Longitude & DateTime and a few nifty table calculations. Well it turns out it is possible, it took a lot longer than I had anticipated but I was able to do it.
Using the Great Circle Calculation I was able to calculate the distance between each lat/lng at each recorded interval and datediff gave me the duration between each interval, the using Running Sum I could calculate the total distance and total time;
Once you know those 2 things, calculating speed, pace, average speed, average pace were easy. The only thing that caused a little thinking was trying to work out the average speed/pace per mile. The way I did it was probably a little over complicated but it worked. I essentially worked out where each mile started and each mile ended and then used Window_Avg to dynamically look through the table and just calculate the average for the particular mile that the row was in;
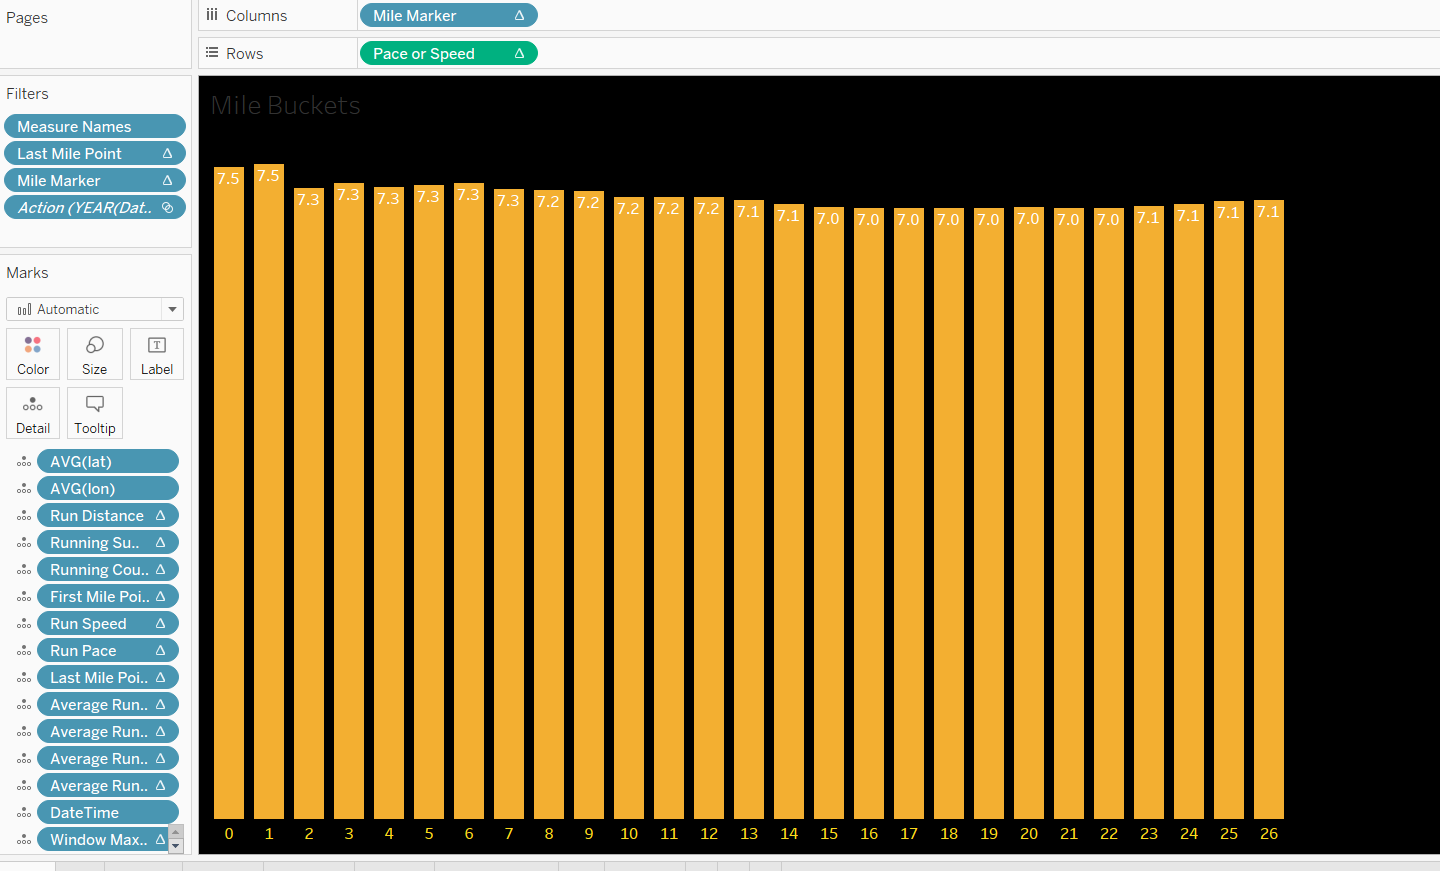
And here is the final viz;
This workbook (and all of my other dashboards from dashboard week) is on my Tableau Public profile if you wish to steal the work and claim it as your own!
Enjoy