There are many blogs about how to change a custom colour palette, but some of them are hard to follow, hopefully this will help those of you who like me had to combine about 6 to work out what was going on;
Tableau has many ready-made pallets inbuilt (that seems to get more numerous with each update), but often you can be working on something that has a pallet that needs to be created; or you are working within a restrictive brand colour pallet. This can often cause lots of remembering hex codes or recolouring them continuously. There is, however, a way to make a permanent change to your available pallets saving you lots of clicking and hex colour picking.
Before continuing, I would recomend unloading (and saving) any tableau workbooks you have open as changing this can cause errors to appear in open workbooks, as we will be editing files within the program.
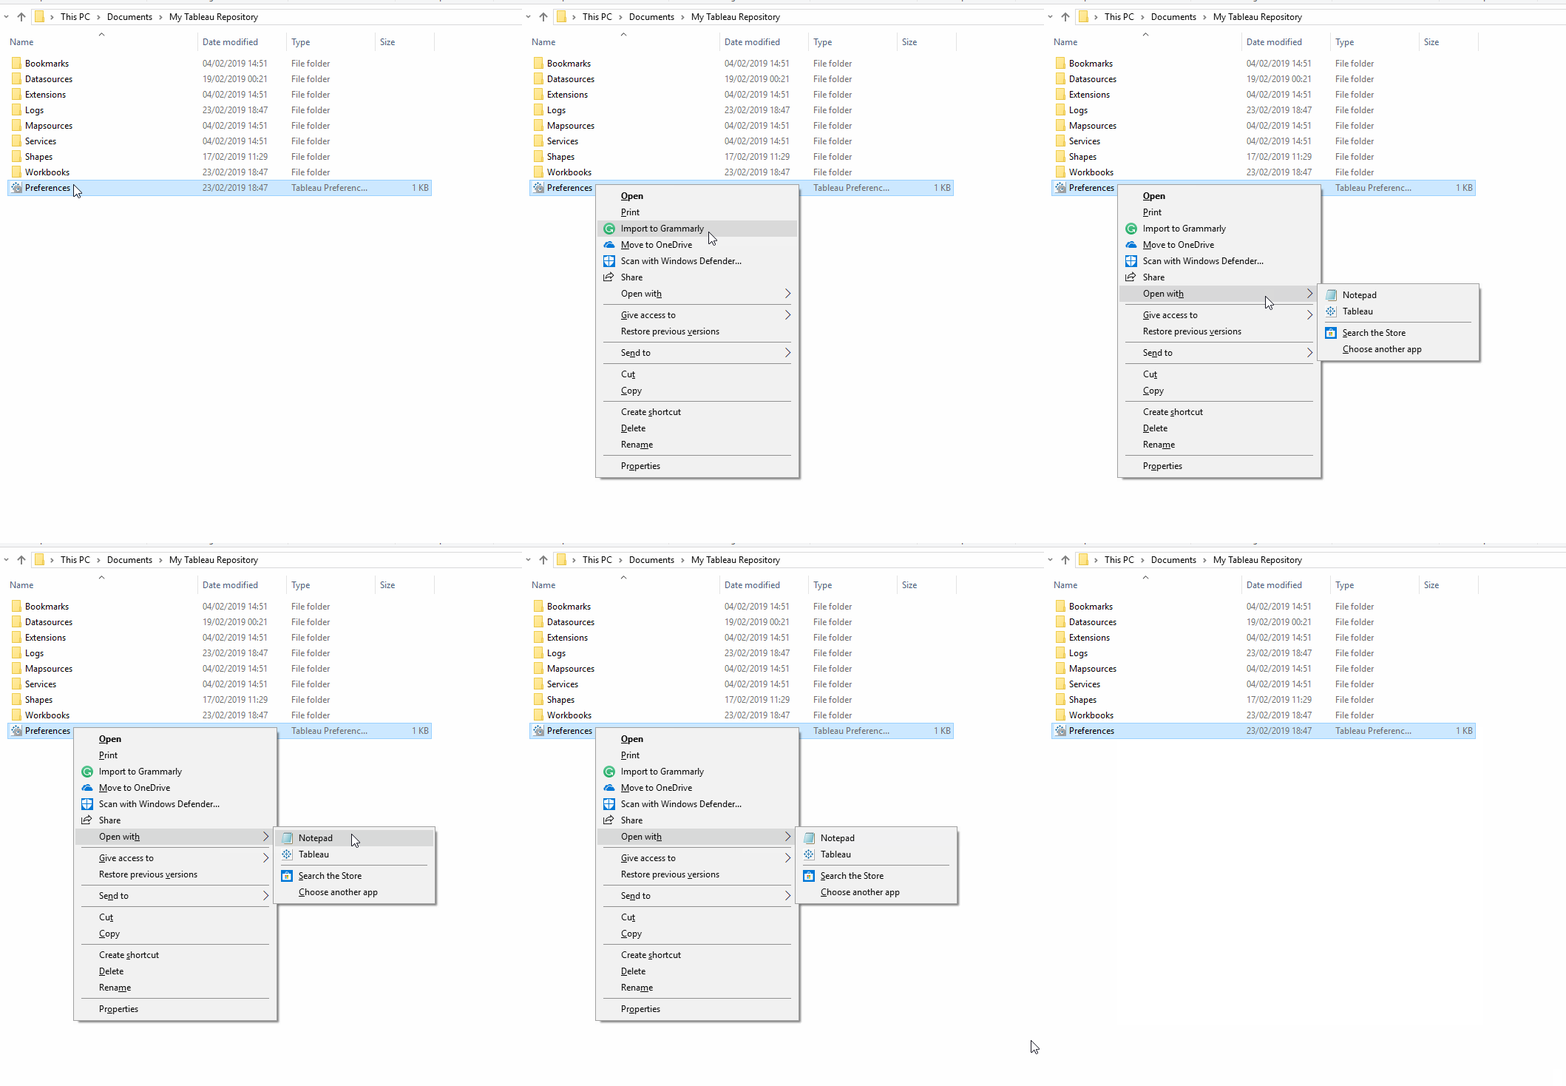
To change these preferences, you will need to access the “my tableau repository”; this can be found within your my documents folder. This may automatically load into Tableau, though Tableau will inform you it is unable to process the file type, this is not what you want, instead you want to load within a text editor (on windows this is by default Notepad). This will need to be done through the open with option.

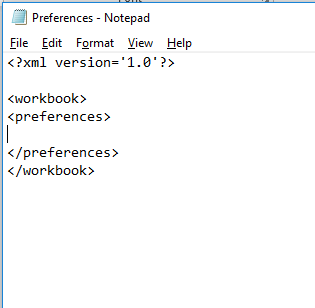
From here you will see an XML/HTML text (they are roughly speaking the same in this instance) to edit this open up your text editor and you will be met with a blank workbook with the following <workbook> </workbook> within the document below <xml version=’1.0’?> so there is a decent space between them and insert <preferences> </preferences>. This informs Tableau to read what is within these areas (the / is used to denote the ending).

Tableau treats categorical, sequential, & diverging colours differently:
Categorical Data (regular):
For Categorical data you want to assign a colour to each category, so a region or different flavour of Ice Cream; creating a legend where each mark is defined by its colour, for this you need to change your preferences to the following –
<color-palette name=”Data School Categorical” type=”regular” >
<color>#5dfdcb</color>
<color>#7cc6fe</color>
<color>#f4faff</color>
<color>#8789c0</color>
<color>#08090a</color>
</color-palette>
This text is to go within <preferences> </preferences>
Sequential Data (ordered-sequential):
This is used for data that has a natural start point you are working away from, so this could be distribution across a map with darker shades representing larger amounts. This will be treated slightly differently by Tableau and will need to be within a colour and then varying by shade. This can be written into Tableau as the following –
<color-palette name=”Data School Sequential” type=”ordered-sequential” >
<color>#ed6a5a</color>
<color>#d86152</color>
<color>#c2574a</color>
<color>#ad4e42</color>
<color>#97443a</color>
</color-palette>
This text is to go within <preferences> </preferences>
Diverging Data (ordered-diverging):
This is used for data that has a natural mid-point, often 0, to show how colours diverge away from this point. This is most often shown in areas such as profit with deeper blues showing profit and reds showing losses. These are essentially sequential with a natural mid-point that is not the beginning. This can be written into Tableau as the following –
<color-palette name=”Data School Diverging” type=”ordered-diverging” >
<color>#5dfdcb</color>
<color>#7cc6fe</color>
</color-palette>
This text is to go within <preferences> </preferences>S
So, what is going on here?
The name of the palette is defined by the text within the “ “ after the color-palette name. Tableau uses this to determine its name within the colour window. Tableau defines which of the 3 types the palette is for by the contents of “ “ following type= this can only be the 3 types above; Categorical Data (regular), Sequential Data (ordered-sequential), & Diverging Data (ordered-diverging).
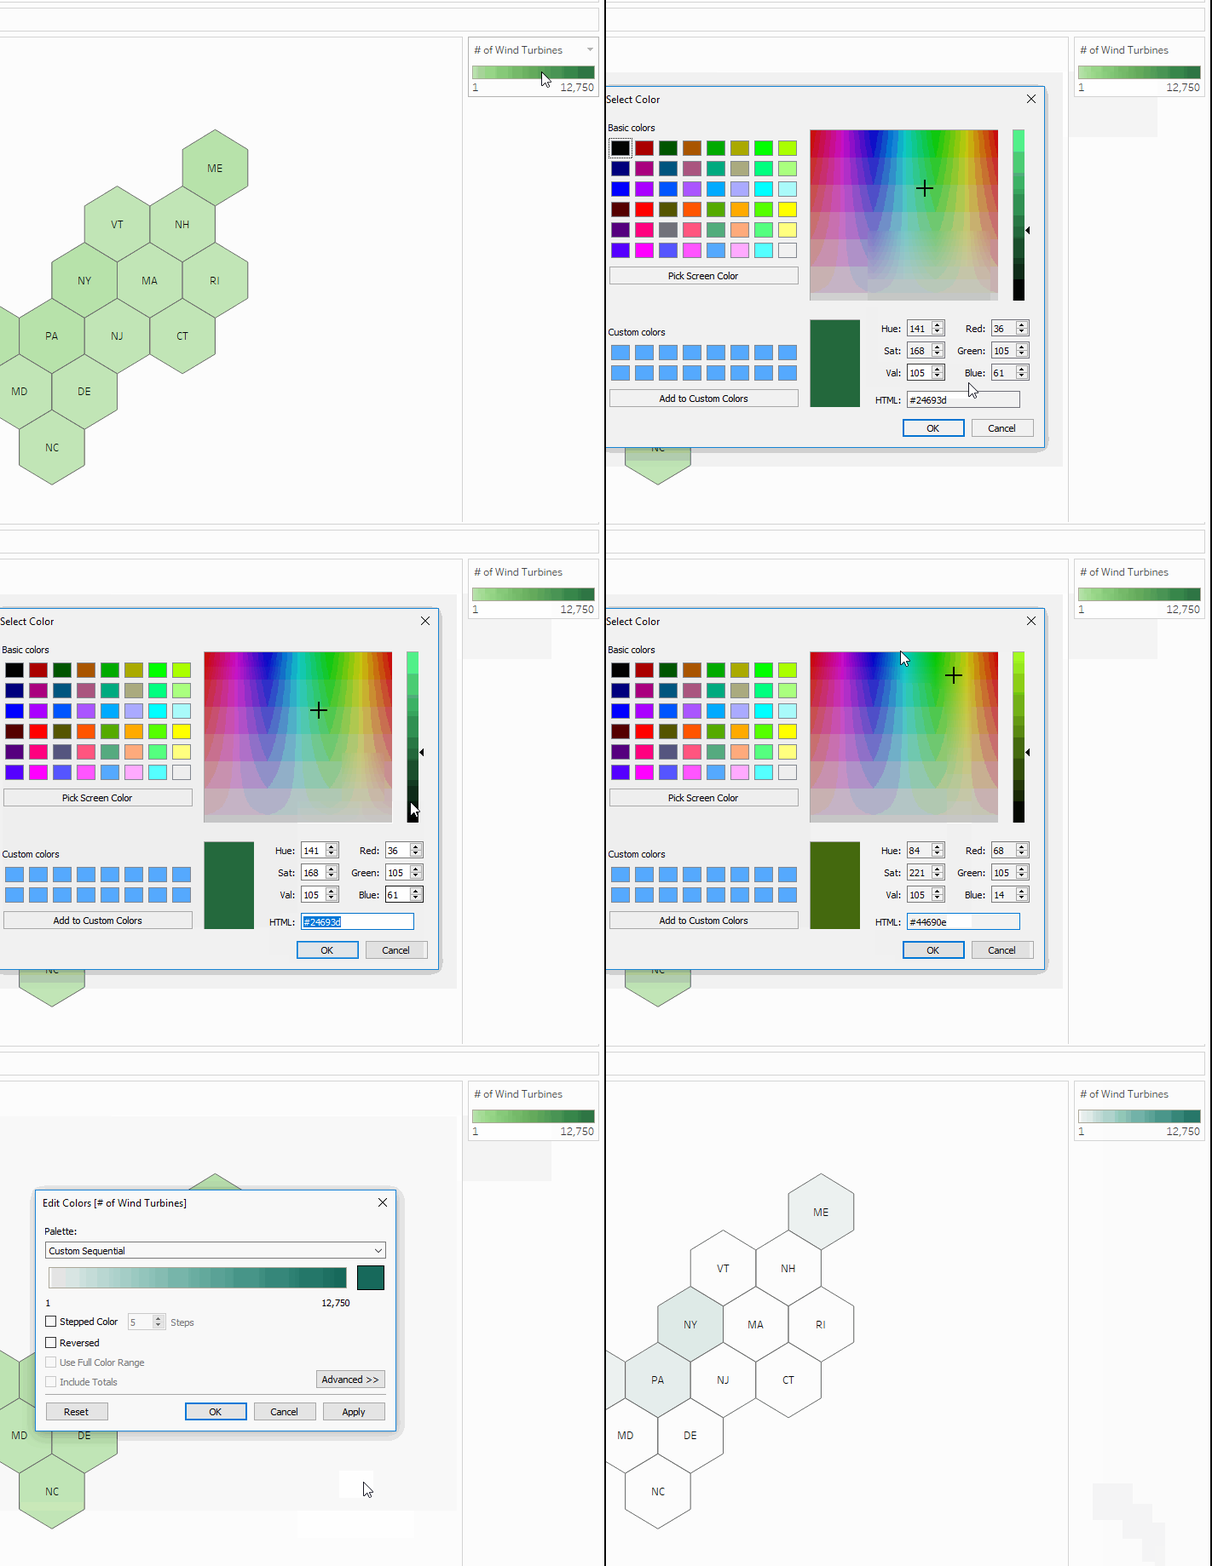
The colours are then defined by the Hex (#) code, this can be found within the colour picker on Tableau and other products;

You are able to stack as many palettes as you may like within your Preferences file. These will stack on top of each other, though must still be within the <color-palette> </color-palette> though all of these must remain within <preferences> </preferences>. It will look like this –

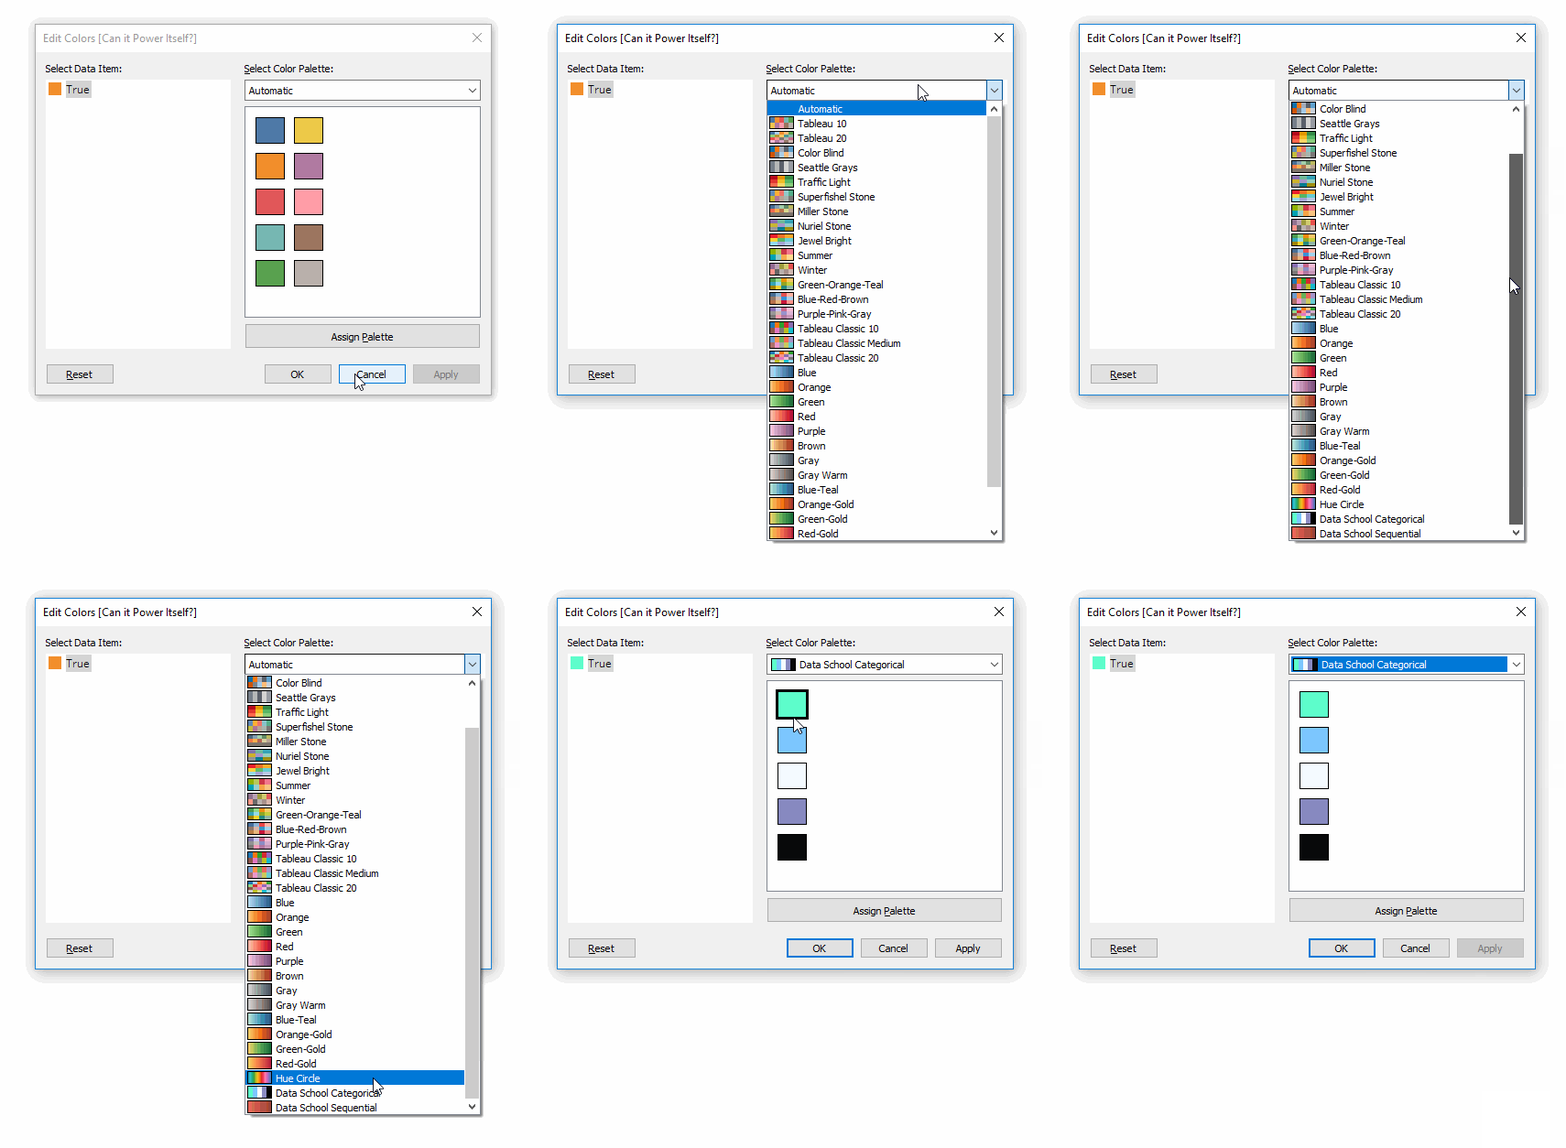
To tell if these are correct, load up Tableau, open up a workbook and load into your colour picker like previous, you should see your new colour palettes at the bottom of the list.

It must also be noted that all spellings of colour must be in American English, so without the u, and instead color. Due to its development in the USA it uses color as the spelling and does not register when using colour.Hopefully Tableau can change this with a future update and spell it correctly!
Hopefully this lets you know the underworkings of how to change a colour palette and be able to troubleshoot if problems occur.
Before you go, dont forget to check out Alessandro’s blog on the best uses of colour within your dashboards.
