In our second day of dashboard week, we were tasked to create a dashboard that maximised creativity and design whilst showcasing some level of insight. The dataset was based off World Cup historical data on the Men's side, which is data quite familiar to me since I have worked with football data in the past.
Below is the dashboard outcome as an image:
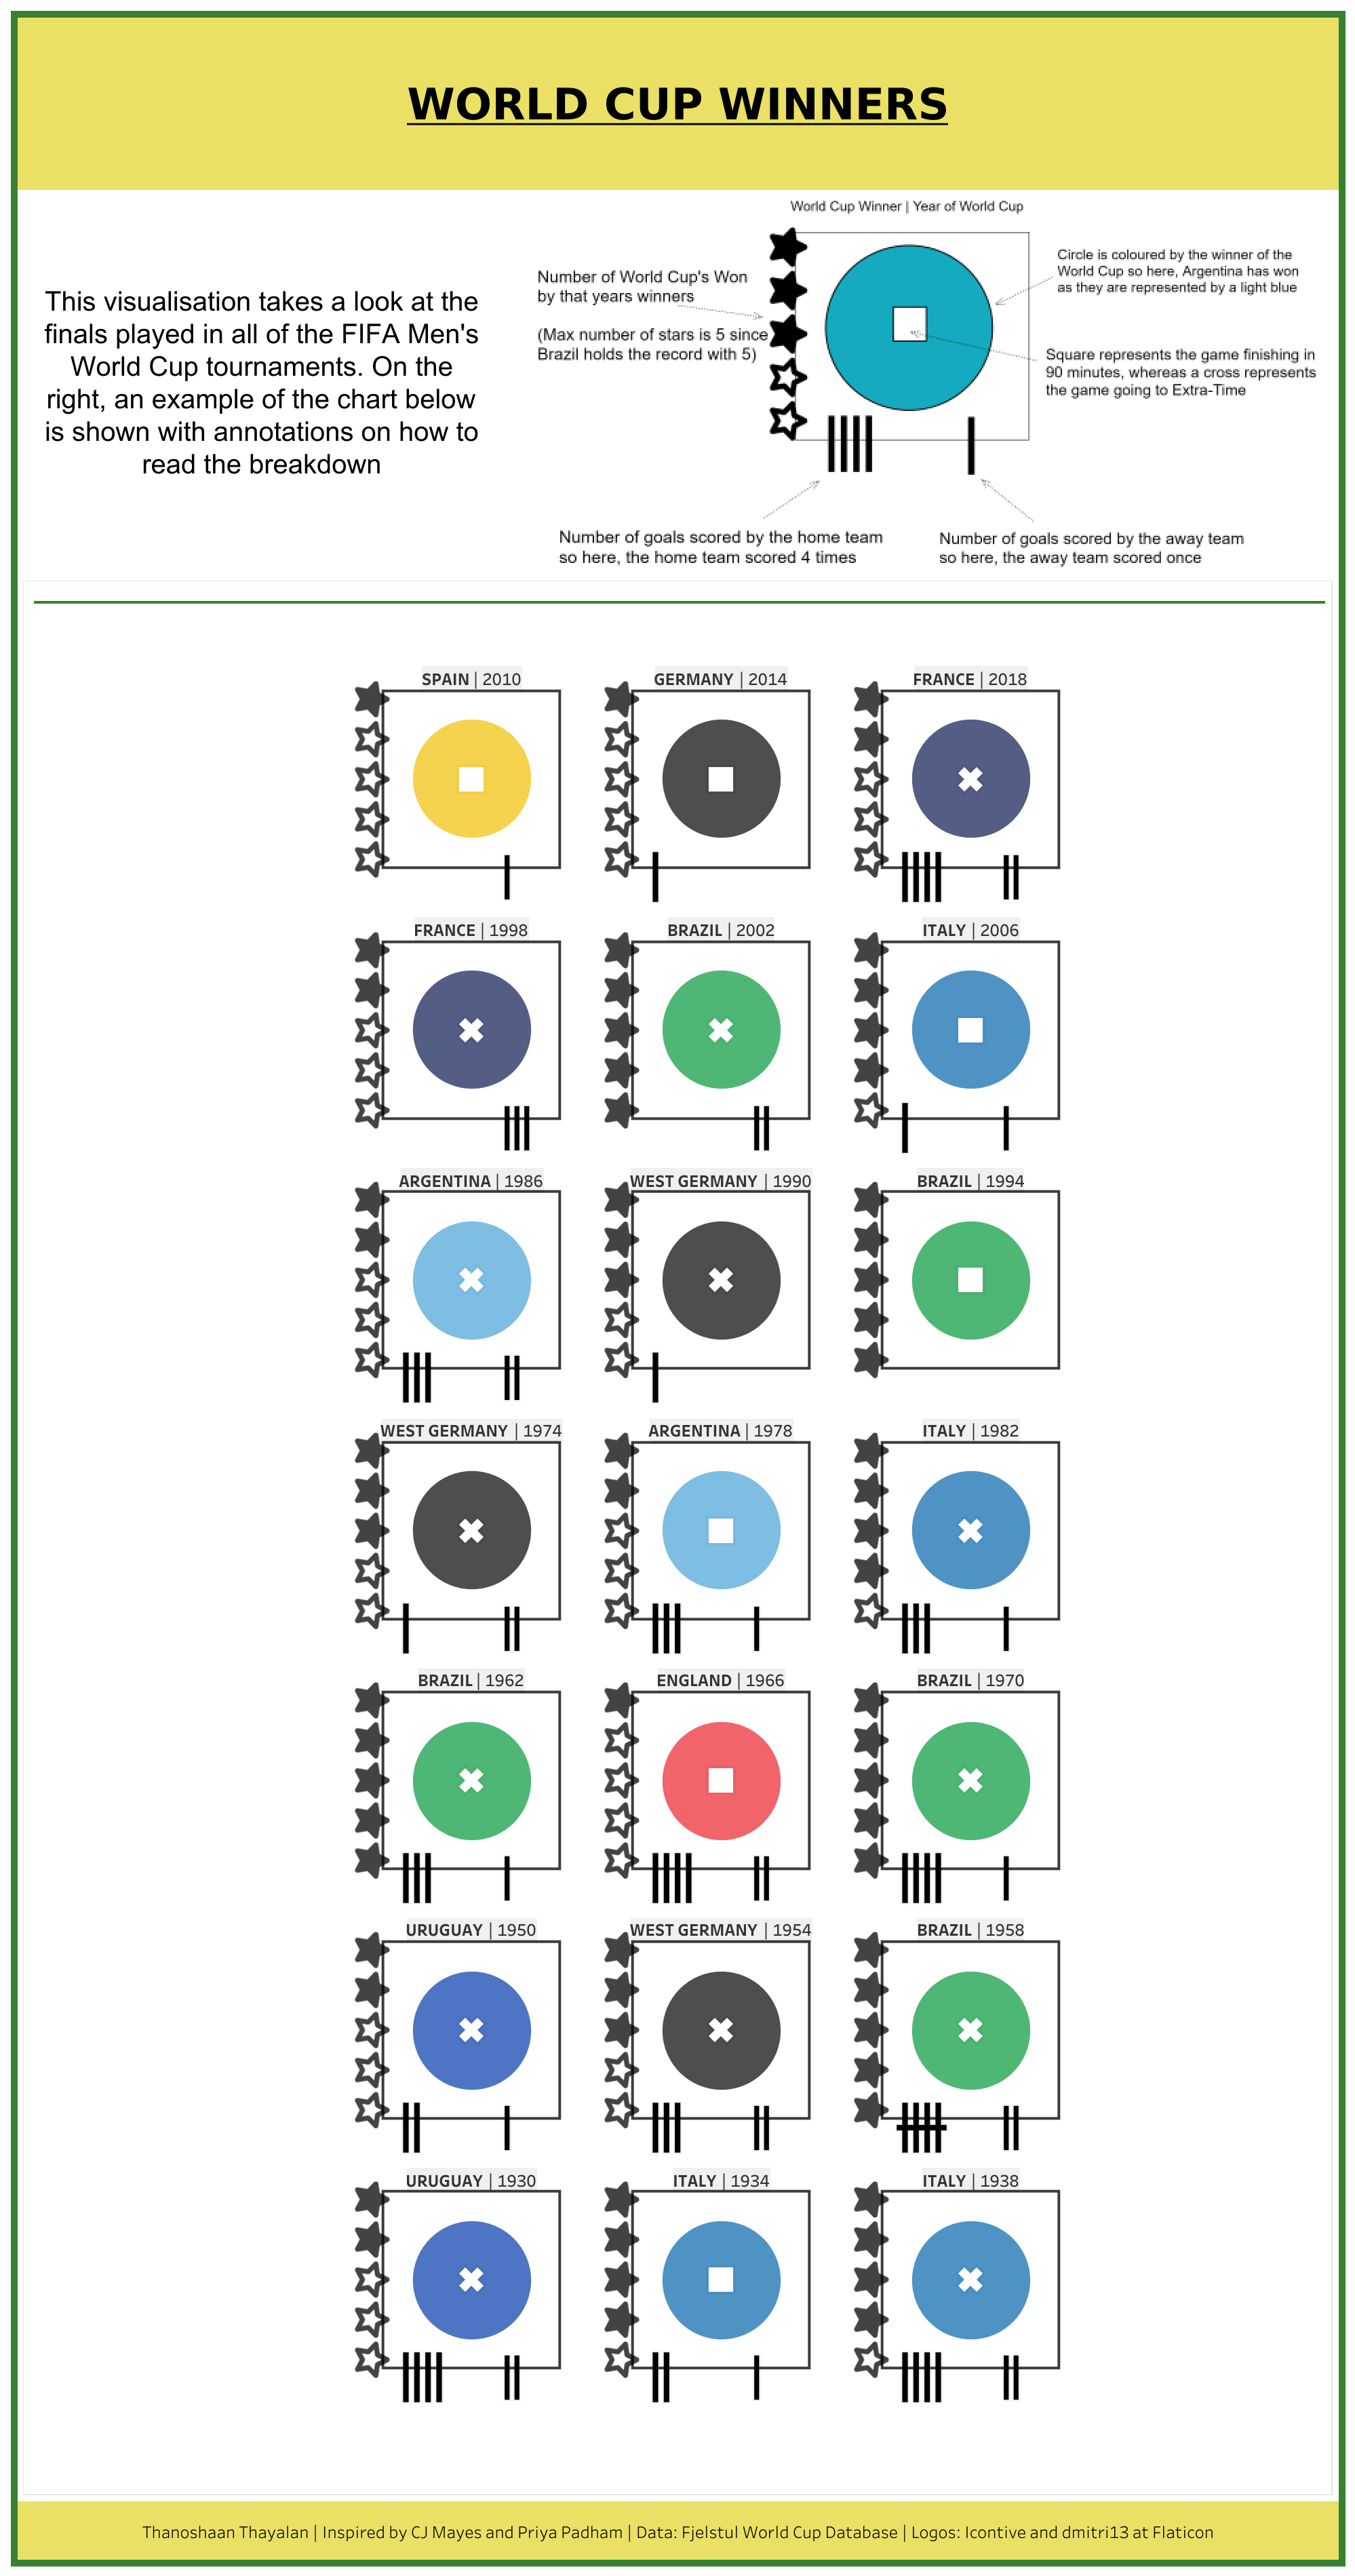
Key Inclusions:
- Creating a completely different type of chart that maximised information in a visual way
- Legend to give the user an understanding of how to read the dashboard
- Inclusion of all available data rather than having years filtered out to give an overview of the entire World Cup history
Challenges and Feedback:
- Getting used to building a completely different type of chart design
- Finding a decent colour scheme for all nations who had similar colours
- Formatting the view so that the most recent years go from left to right
The link for the dashboard above: https://public.tableau.com/views/WorldCupWinners_16589323225210/Dashboard?:language=en-US&publish=yes&:display_count=n&:origin=viz_share_link