Continuing with calculations, as we did a bit of Level of Detail calculations, now we will do some analysis using table calculations. In this case, we will be going over on how to measure top 3 things by something within the same category, i.e., top 3 states by sales within each particular region.
We will calculate this using the index calculation. However, there are different ways of calculating it. We can use rank, first (descending), last (ascending, last + 1 gives rank).
We will be using Superstore dataset.
So, let's begin!
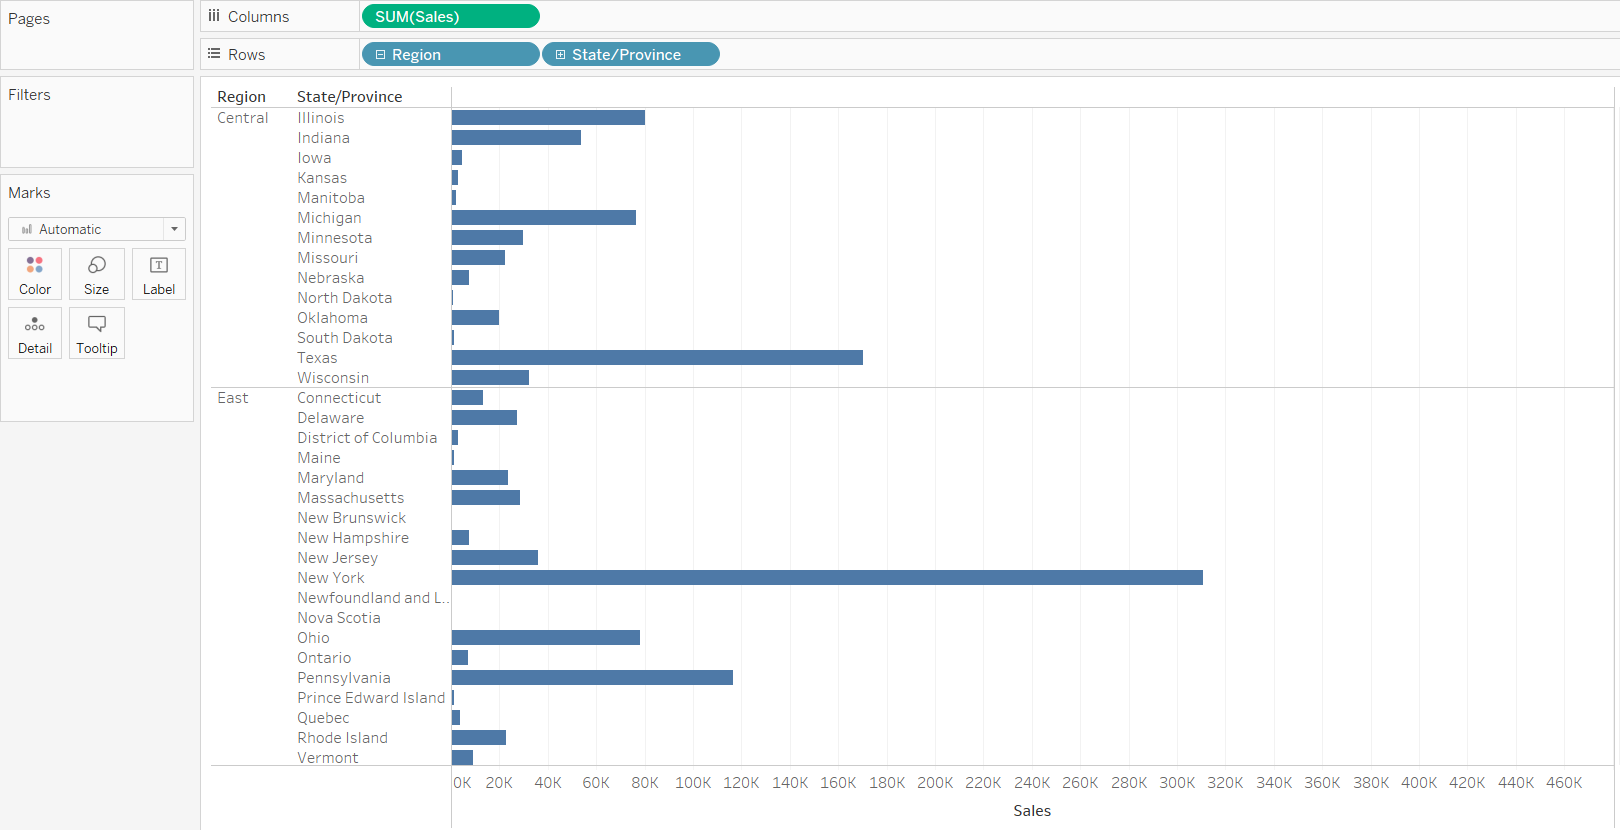
To begin let us add region and state on rows and then sales on columns. Your view should look like this:
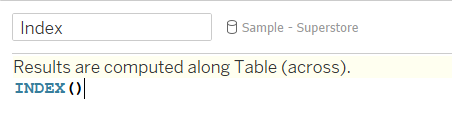
Then, we have to create a calculated field for the Index calculation. It is always easier to do your table calculations as a calculated field. This way, you can make sure you know what they are doing, and you can remember what you are using to do these calculations. The calculated field should look like this:
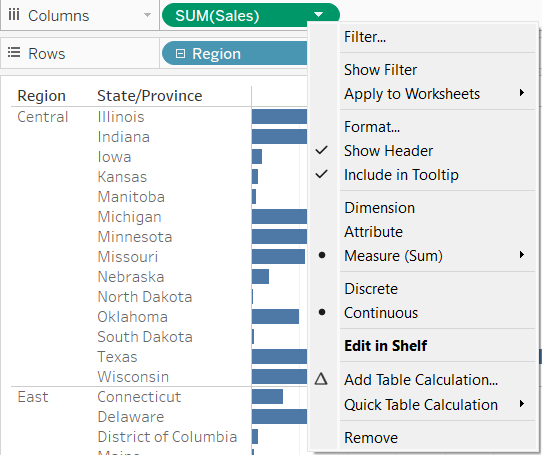
Doing different type of table calculations, you can right-click on a measure and select add table calculation and select one of the ones you might need, which should look like this:
To know what calculation is going on behind this table calculation, you can double click on the measure where the table calculation is applied, and you will be able to see what is going on.
Going back to the index calculation, now, we need to add it to rows, preferably between region and state as we want to find out top 3 states within each region.
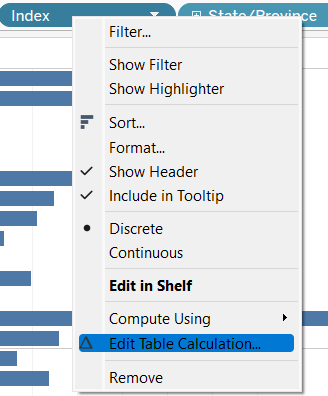
At first, we need to configure the index calculation to make sure that it restarts every region. To do that, we right click on index, and select edit table calculation.
You should get a window pop up that looks like this:
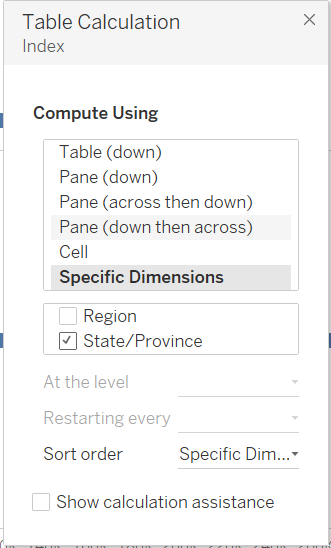
We need to select specific dimensions and deselect region as that's when we want the index to restart.
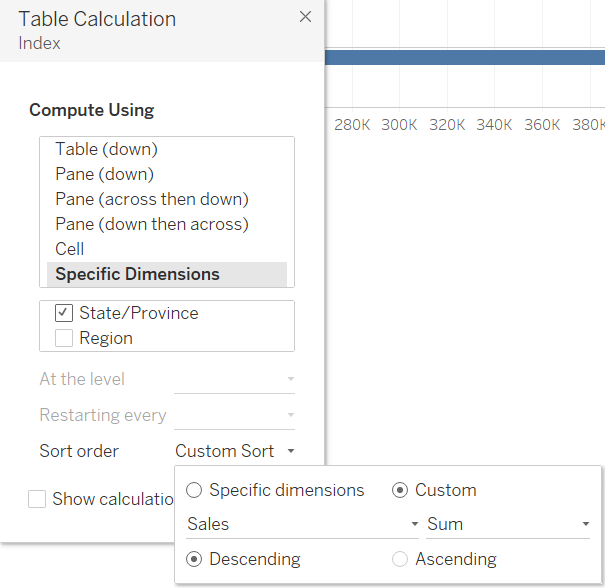
Also, we need to select sort order and select sum of sales and in a descending order. It should look like this:
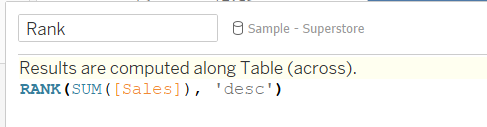
We are nearly there; we just need to create one more calculation. To make sure that the sales are ranked descending, we will create a calculated field that ranks the sales in a descending fashion, so we get the ones with highest sales. It should look like this:
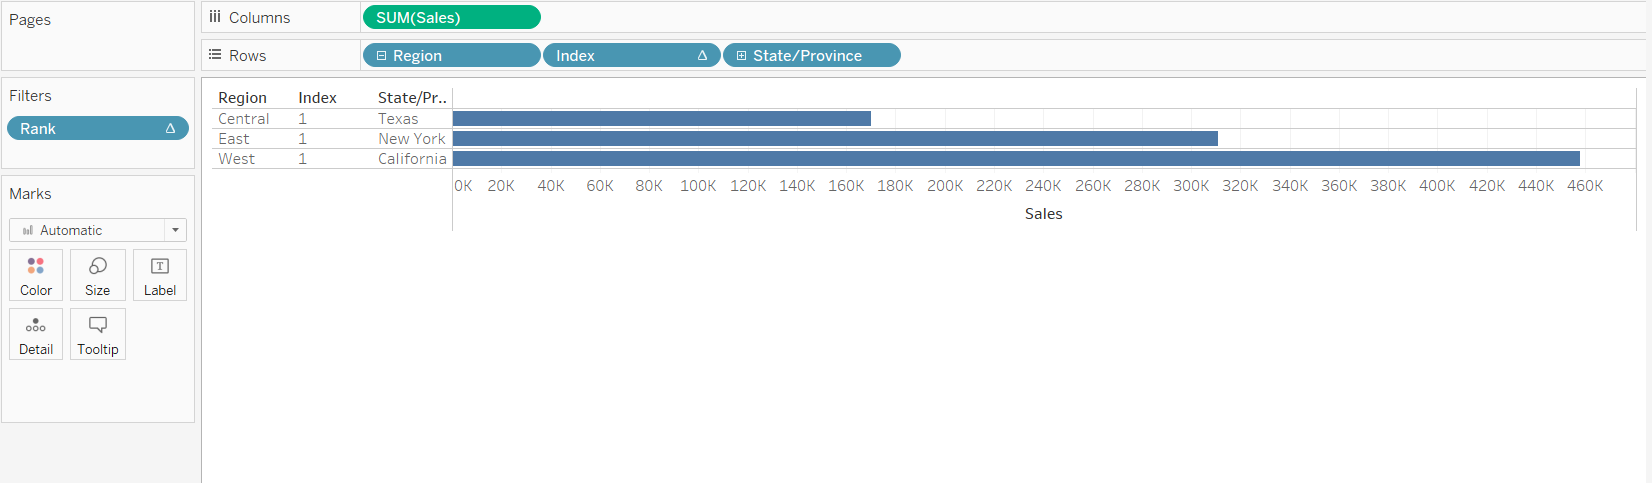
Now, we need to add that calculation to Filters card, and select 1,2 and 3. You should get a view that looks like this:
However, we need to fix the rank calculation. If we right-click on the rank and select edit table calculation and then deselect region in specific dimensions like this:
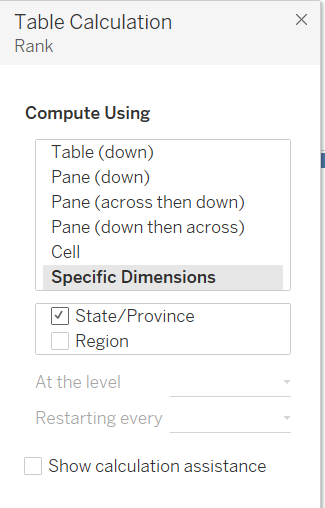
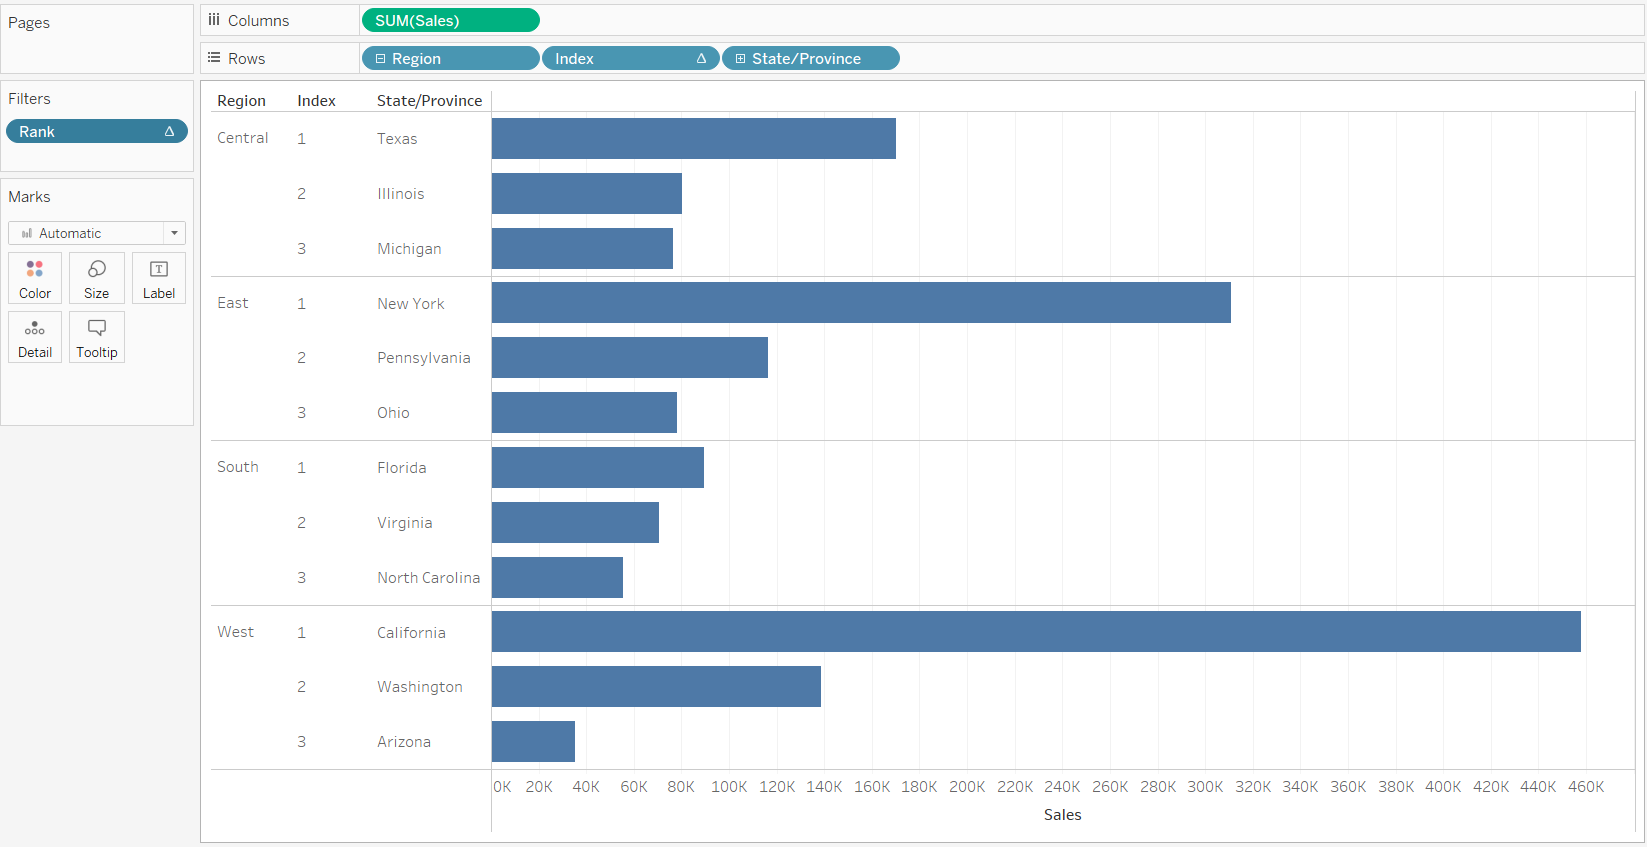
Finally, we need to reselect 1,2 and 3 on the filters card and voila, you've got what you have needed to calculate. Your final view should look like this:
Hope this helps!