


For todays challenge we used a Breaking Bad API in order to pull data from the web, transform it and upload it into Tableau so that it can be used to create a dashboard.
In this blog I will outline how I pulled through the data from the API and transformed it ready fir Alteryx. The API can be accessed from https://breakingbadapi.com/
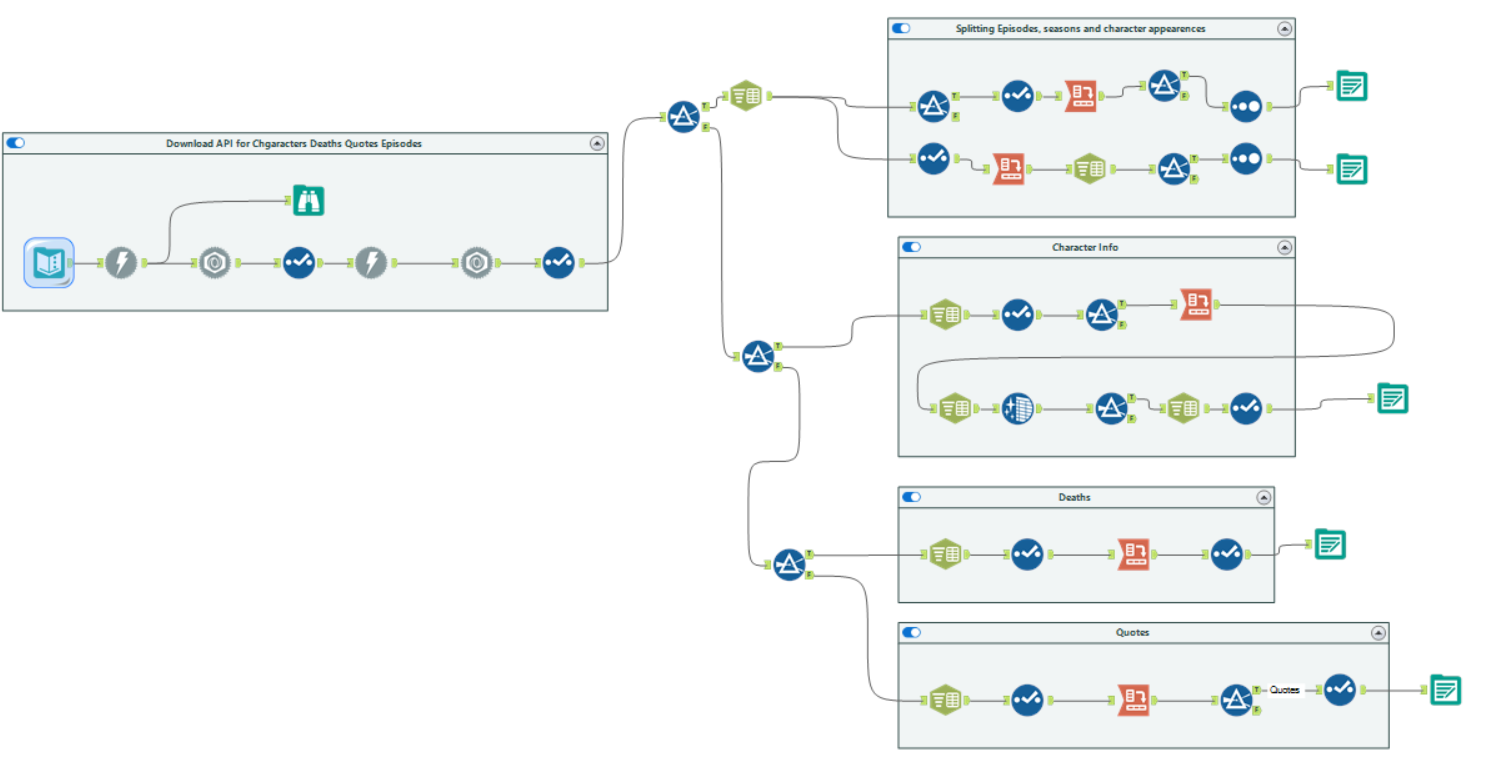
I started by adding the base URL https://www.breakingbadapi.com/api/ in a text input tool. I then used a download tool followed by a JSON parse tool to extract the data. This lead to 4 more categories being sown Episodes, Characters, Deaths and Quotes. When it came to this point I could either have a text input for each of the new URL's or I could use anther download and JSON Parse tool to extract the data in one go. I then used a select tool to clean up the data followed by a range of formula tools in order to separate out the 4 categories so that I could work on them individually.
The process for cleaning each of the categories was pretty similar in structure so I will just outline how I cleaned the episodes data.
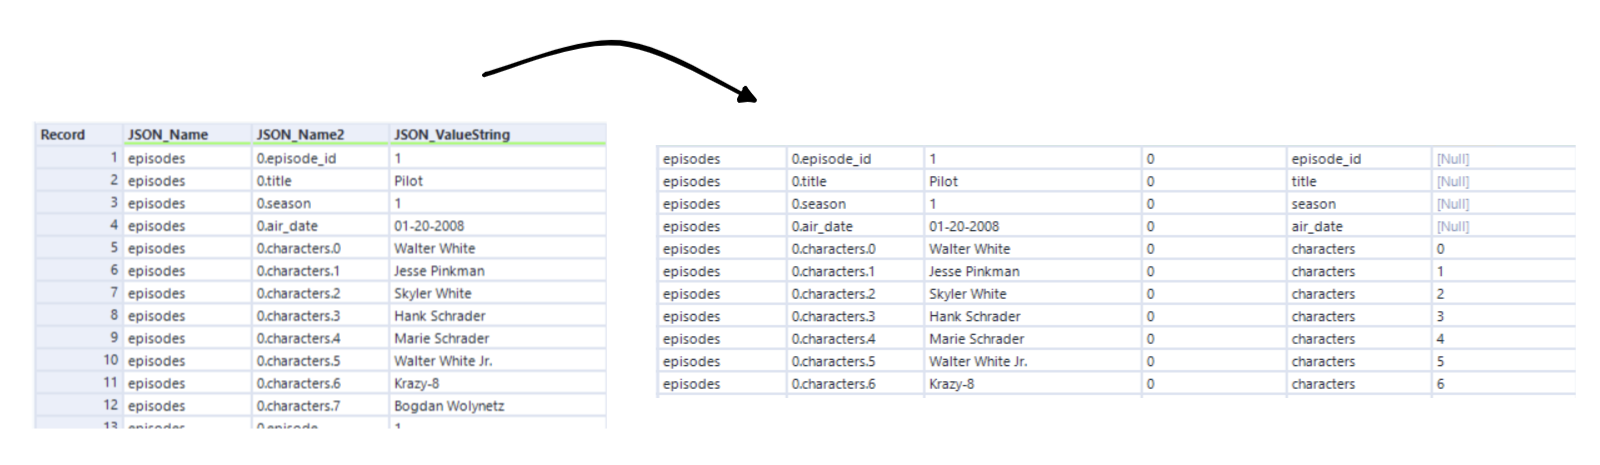
I started with a text to columns tool and changed JSON Name 2 with a separator of '.' this separated out the names that would become the new column headers in a more readable format.
I then came across an issue because the data included information on the names of different characters that showed up in each episode which would make it more difficult handling the data. because of this I decided to split the data up into two further tables. One with data about what characters were in an episode and one just focusing on the episodes, season, airing date etc. Therefore I used a filter tool to filter out any of the rows that contained 'character' information. After this i used a Crosstab tool to change the rows into headers
When doing the cross tab I made sure to group by the number that was given at the beginning of JSON Name 2 before it was split in its own row. After this i did some finer tweaking and it was ready to export.
For the character episode information I used a cross tab to make the the new column headers with the character information. Because the characters in each episode had the name name they were all placed in the same cell after the cross tab. this was easily changed by using a text to columns tool and selecting rows. This meant that all the characters for each episode would have their own row of data. I then again did some final cleaning tweaks and it was ready to export.
Repeat the process of using crosstab and text to rows tools for the other 3 categories and you will have 4 datasets which can be saved as a Tableau Hyper extract and uploaded to Tableau to create a dashboard.