For our second day at dashboard week we had to create Mockaroo data for an industry type of our choosing and then create a KPI Dashboard on Power BI.
To start the project I spent some time researching different industries and looking at what sort of data they may have. After spending some time I decided I would go with agricultural data. Looking further into the data since it was such a broad subject I decided to try and replicate data for corn sales in the US.
I then used Excalidraw to jot down a rough plan for the day, a sketch for my final dashboard layout and also noted down all the dimensions and measures that i could use in my Mockaroo dataset.
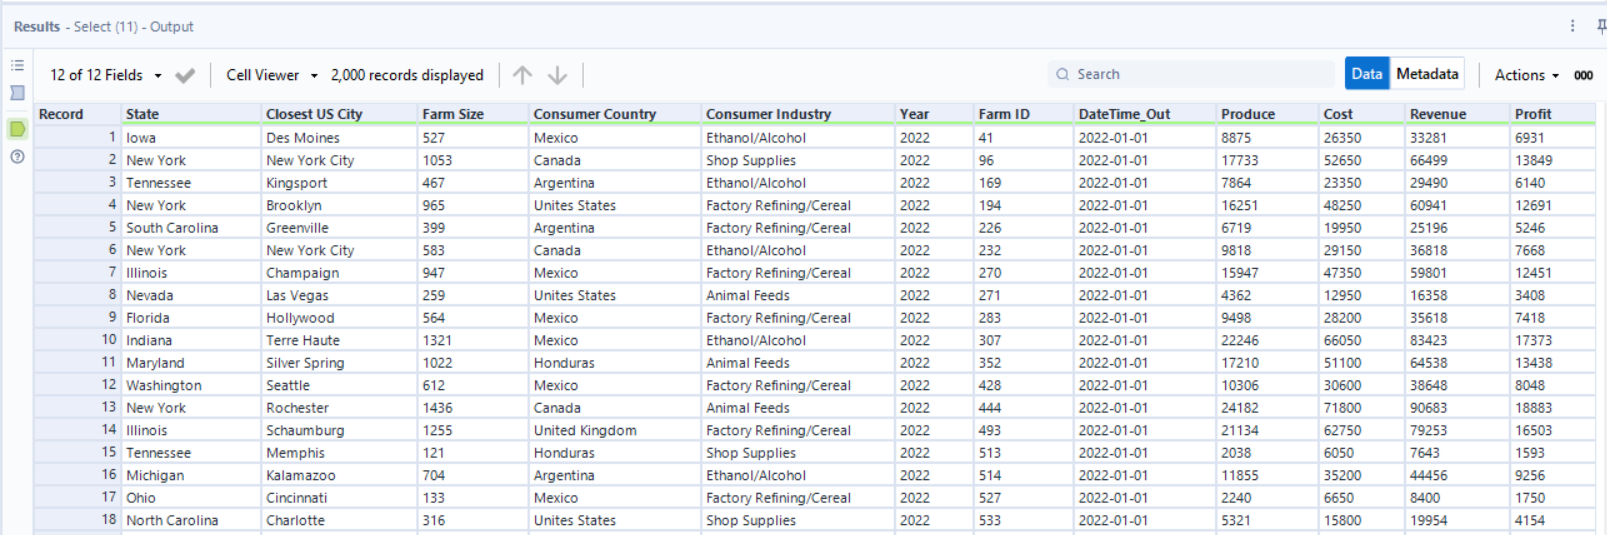
For my dimensions I chose: State, Farm, City, Customer Country and Customer Industry. For the measures I decided to incorporate Cost: Produce Produced, Farm Size and Profit.

I then decided that I would calculate the cost, profit and revenue through Alteryx where I could amend the data types at the same time.
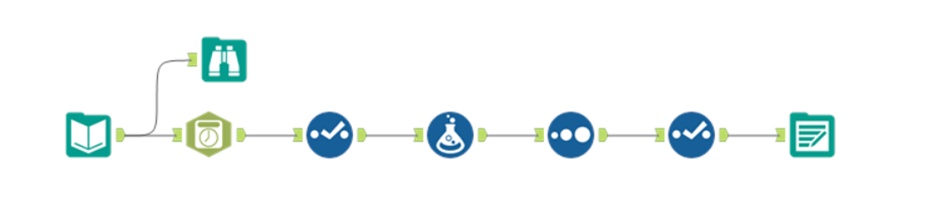
When in Alteryx I used the Date Parse tool to change my numbers into a date format. I used a select tool to change the data types for my fields. I also used the formula tool to create the cost, profit and revenue as new columns.
I now have data that I am happy with and that I can load into Power BI to start the dashboard.
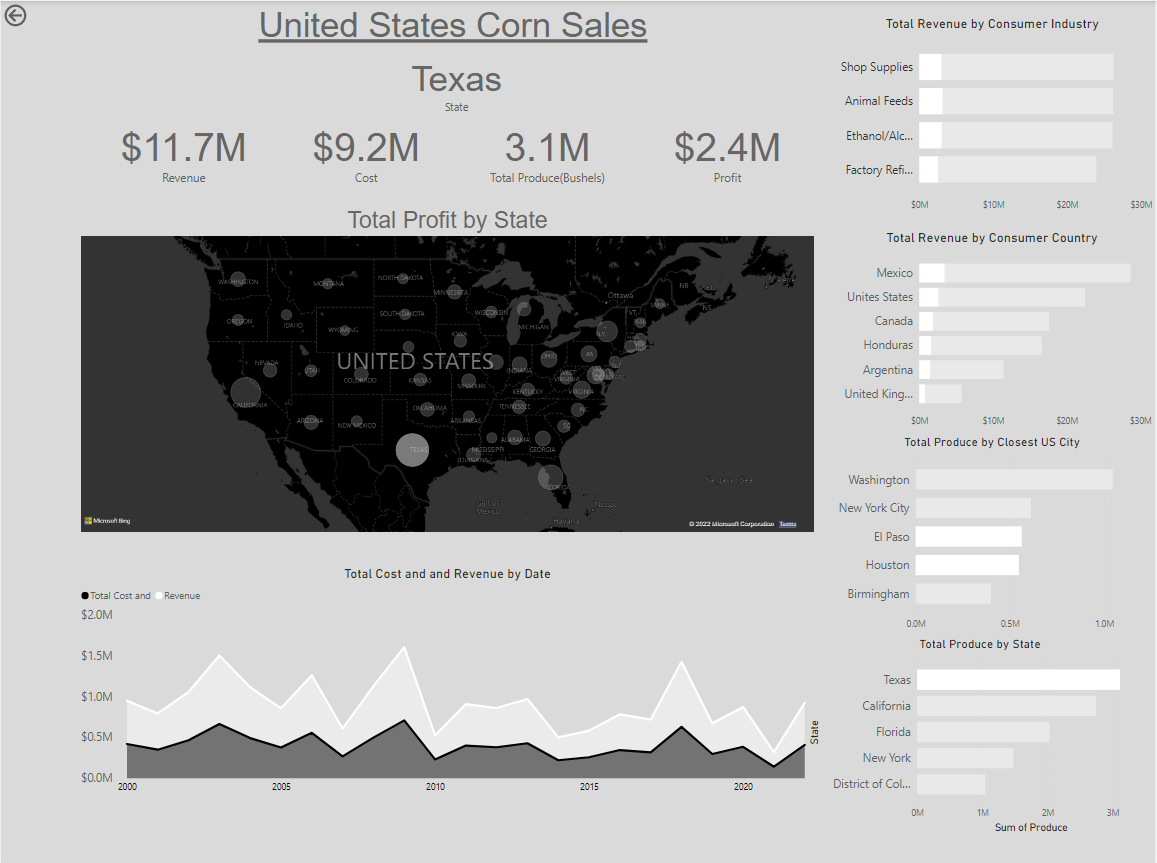
I spent the most of my afternoon playing around with the software and trying to get to grips with how to make the charts look the way I want. After spending so much time using Tableau I found it initially challenging as simple things i wanted to change were taking some time as I did not know how to navigate the layout as effectively as I would in Tableau.
Considering the time restraint I am pleased with the dashboard that I was able to come up with whilst getting to grips with an unfamiliar software.
If I had more time or were to attempt this challenge again I would spend more time trying to get my data to look more realistic by adding more weightings in Mockaroo. This would allow me to change which states produce the most corn so that the data is more realistic as there were some states that are not considered as main farming states coming up with large numbers of produce.