Todays task was to get data regarding boybands and create a dashboard.
The initial data was downloaded as tw0 CSV files, one with boys and one with bands. I initially did a quick Alteryx workflow to join the two datasets together and also did some date calculations to work out the current age of the band members and the age that they were when their song was in the charts.
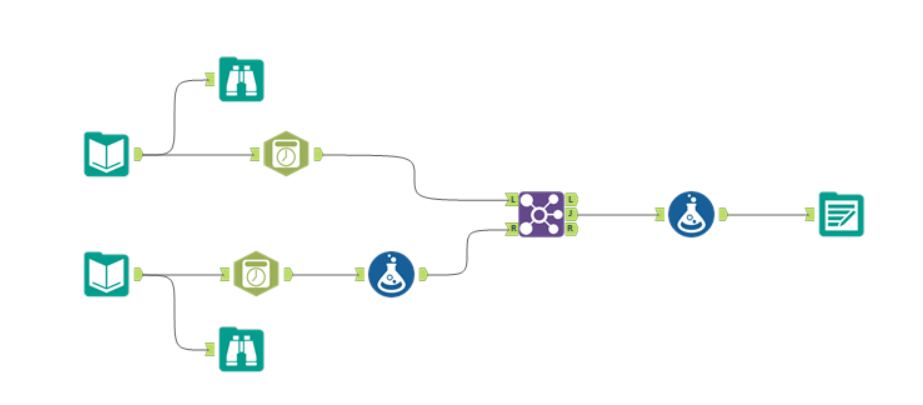
The data was pretty clean to start with, the only tools I used was a Date Time Tool to change the string date for the members date of birth and also the date their song was in the top hits. The first formula tool I used to calculate the current age of the band members. I then joined the data together using a join tool and selecting band as the common field. Once the table was Joined I used another formula tool to calculate the age of each band member when they had their hit single.
Since we only had a limited amount of time to create our dashboard I wanted to keep it fairly simple. Below is my original sketch for my dashboard plan I was aiming for having a fan page like dashboard that would allow people to select their favorite band and see an easily digestible.

When it came to creating the dashboard I struggled to think of how I could make my dashboard more interesting. This lead me to loose some time as I was concerned that my dashboard was too simple. I also had difficulties with the color palate as I used stacked bar charts to display the member breakdown. This lead to be having a large amount of different colors which would constantly change when changing the band and also was very distracting. I therefore decided to remove the color variation from the chart. This then meant that although the dashboard colors no longer look so over powering I did find it.... boring.
I think the reoccurring issue that I have had with dashboard week is that because i know there is only a short timeframe to complete the work I find myself just trying to throw as much together in the short amount of space as I can. Especially after today I feel as though I should spend more time taking a breath and thinking more about what I actually want to show in one chart at a time, rather than focusing to heavily on what I want my dashboard to look.
I think going forward I need to focus more on the story I'm going to tell even if I'm working in a short timeline and allocate more time to working on individual charts and the quality and interactivity if what I'm putting on my dashboard.