To say I was stunned when I woke up Friday morning to learn that the people of the UK wanted to leave the EU would be a massive understatement. So many questions went through my head. How would this impact me and my family? How would this impact the Data School? There’s so much left to be answered, but one thing is certain, what we’re doing at the Data School will live on; it’s too great of an undertaking for the UK voters to take us down with them.
DS3 had a lot of questions when they arrived Friday, so in the spirit of learning, we decided to switch gears and focus on the data around the referendum. We brainstormed possible topics and everyone picked something they wanted to work on. The goal was to spend the next few hours finding data and visualising it in Tableau for our Friday presentations. I’m so proud of the team for turning around such amazing and insightful work in such a short time. This goes to show that smart people, when presented with a challenge, can really excel.
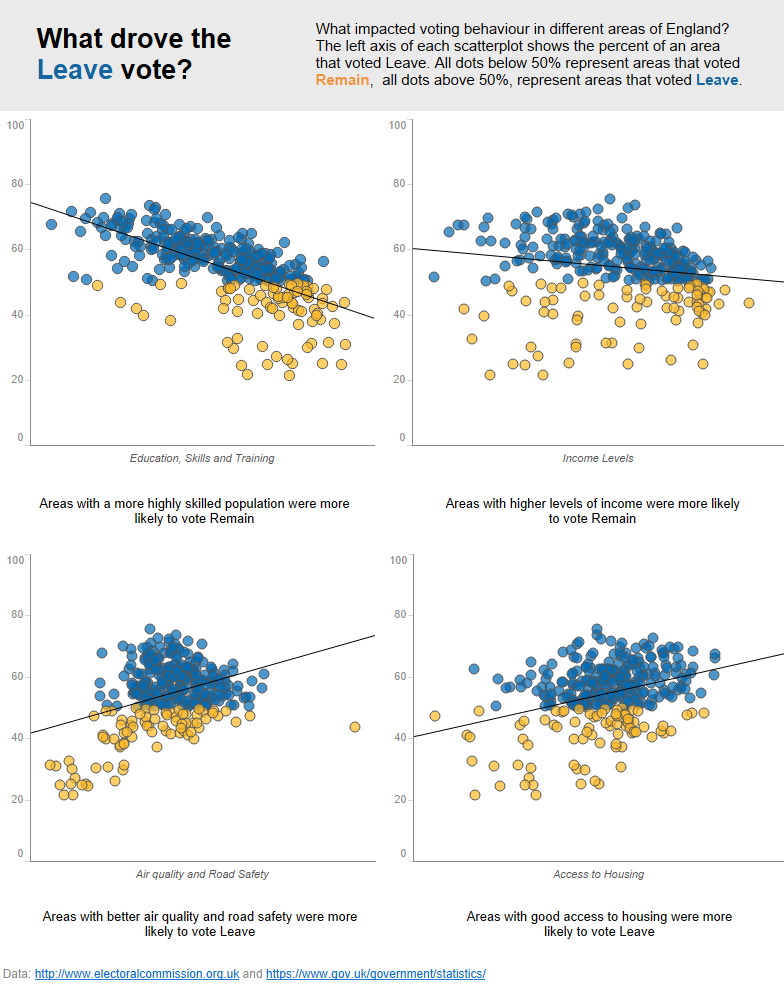
Naledi got us started with this amazing analysis that compares the trends of voters based on their demographics. Fascinatingly, the Guardian created a nearly identical graphic just a short while later.
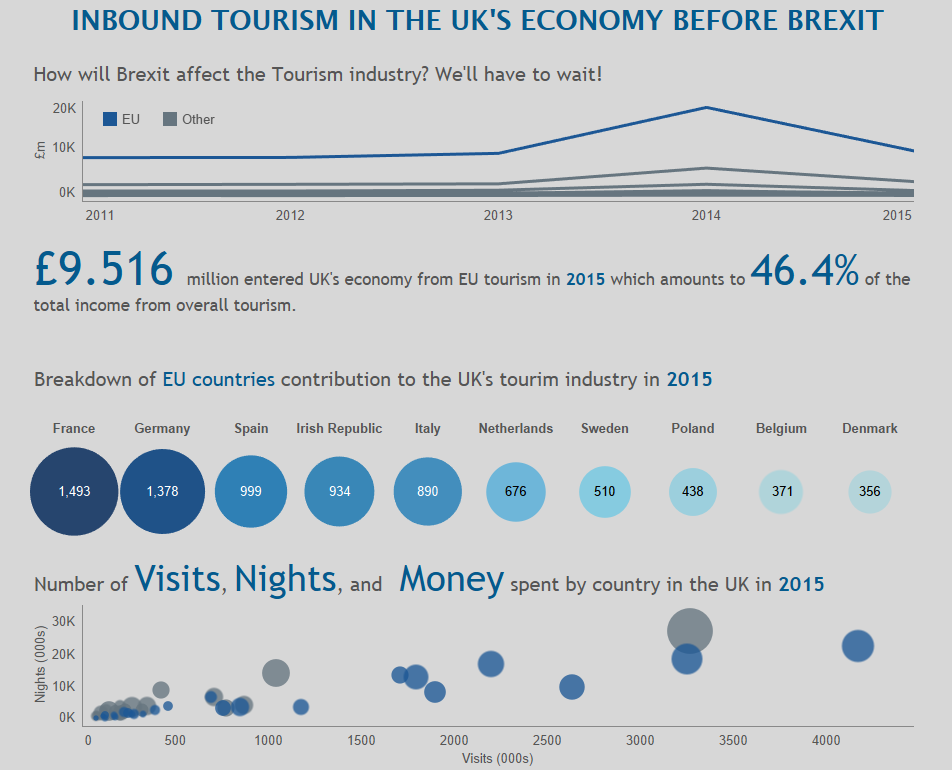
Borja explored the impact Brexit could have on UK tourism. In particular, he focused on the countries that spend the most in the UK.
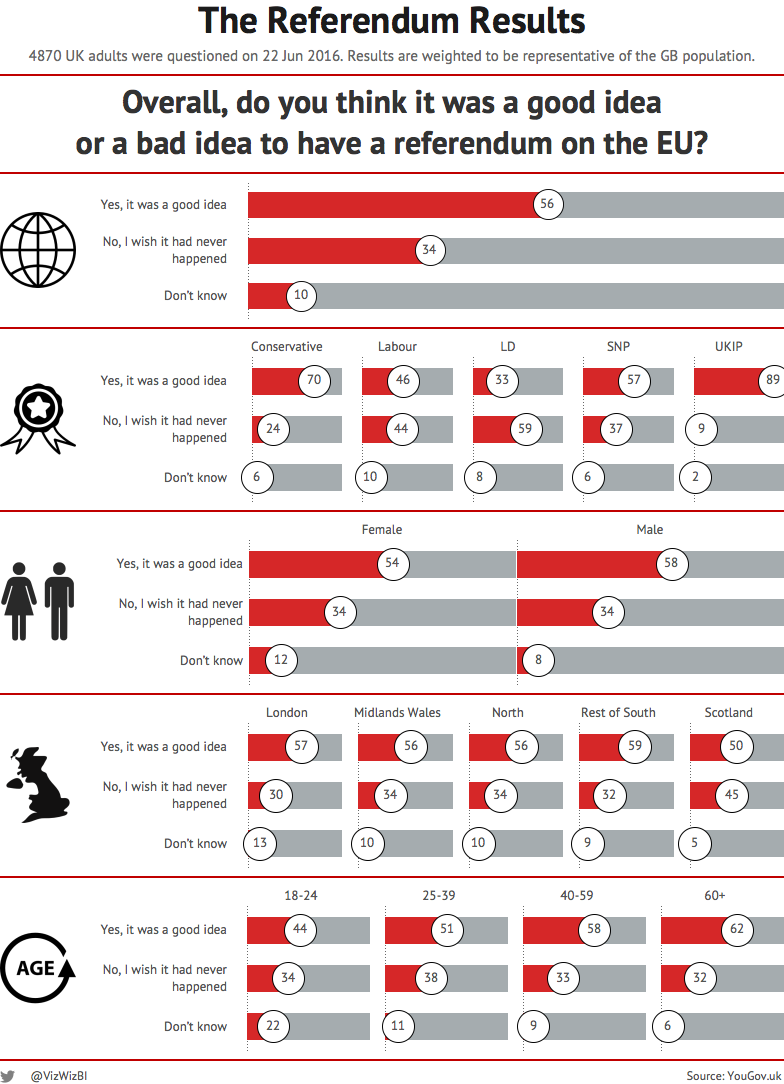
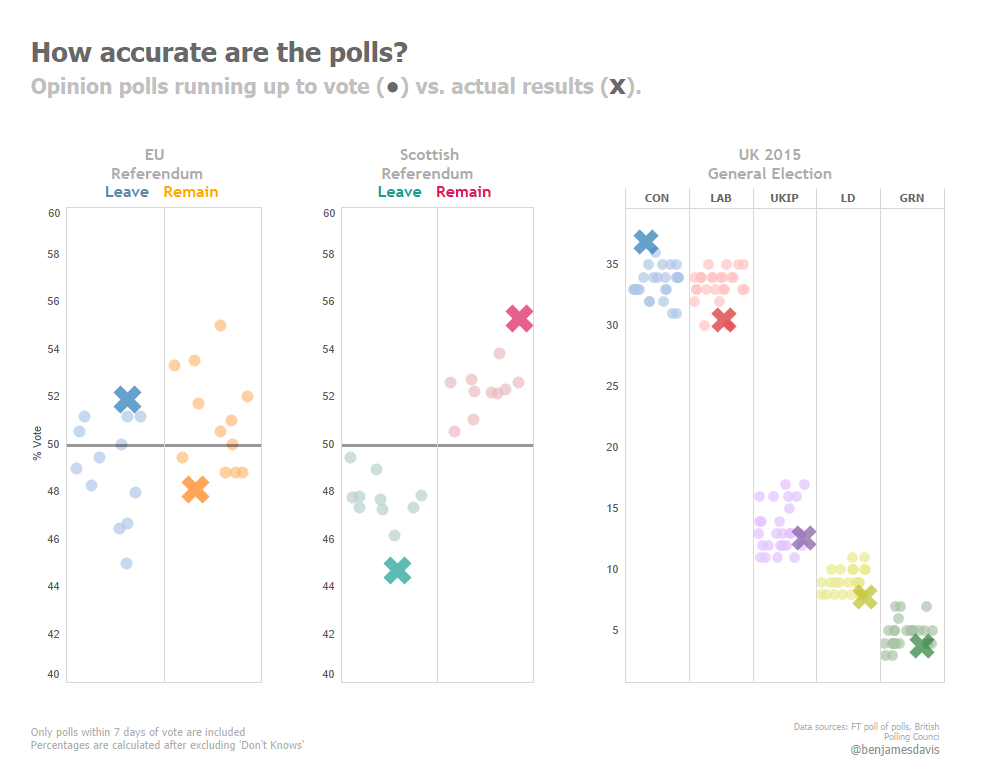
I then presented an infographic about the polls leading up to the vote. These polls closely match the actual voting patterns.
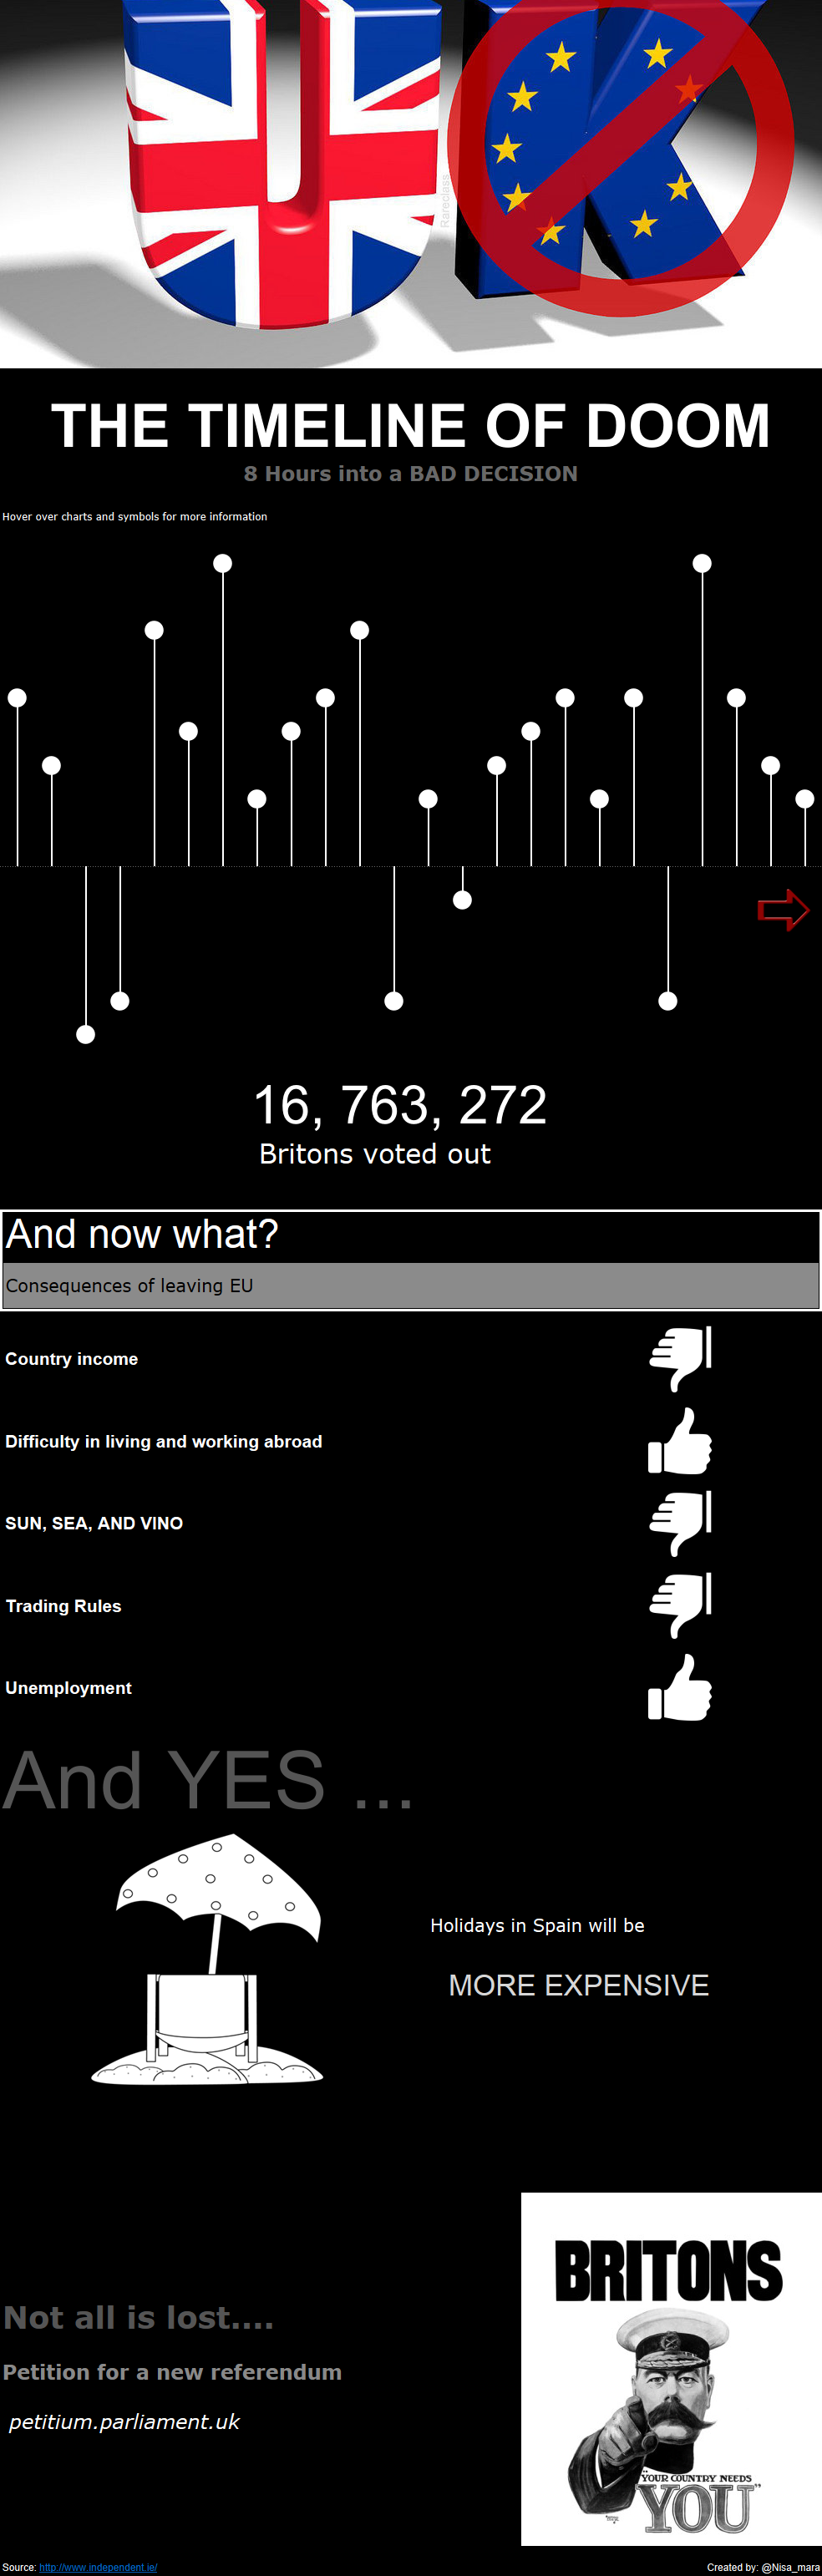
I encouraged Nisa to create a story that was more of an editorial or opinion piece. And did she ever deliver with her Timeline of Doom!
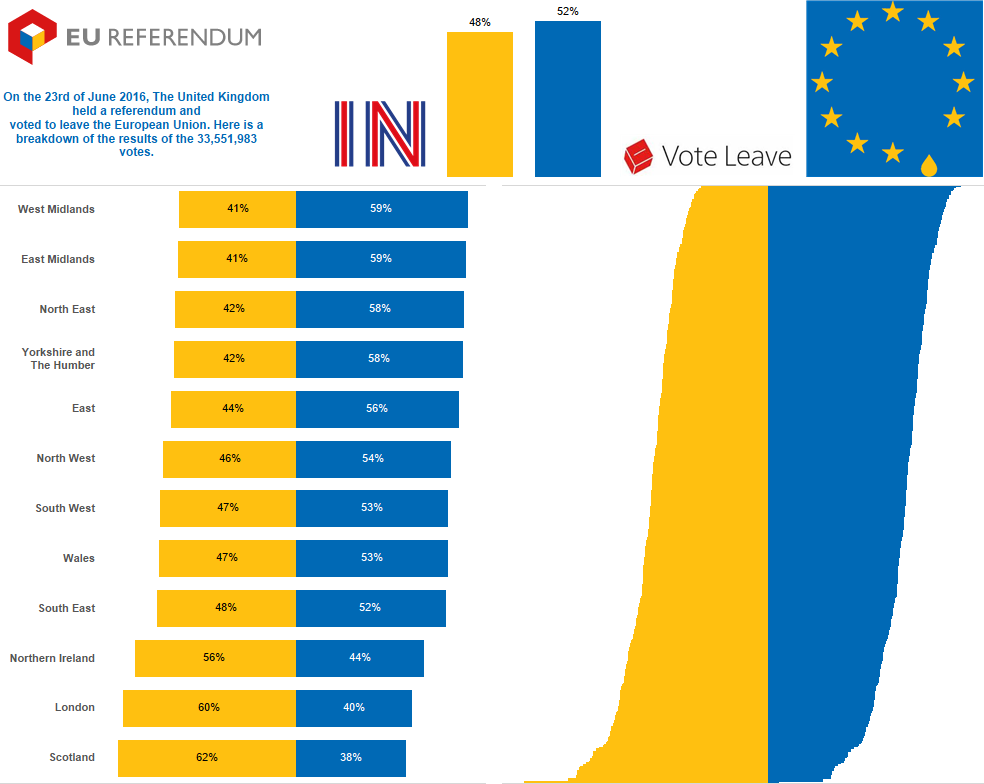
Amanda focused on the voting results themselves, more specifically the geographic distribution. It’s very interesting to look at each region and how its local areas voted.
Ben has an amazingly ability to take very complex data and turn it into a simple story. His examination of historical polls versus the actual results showed some striking problems with polls in the UK. Basically, they’re not very good at predicting the actual results.
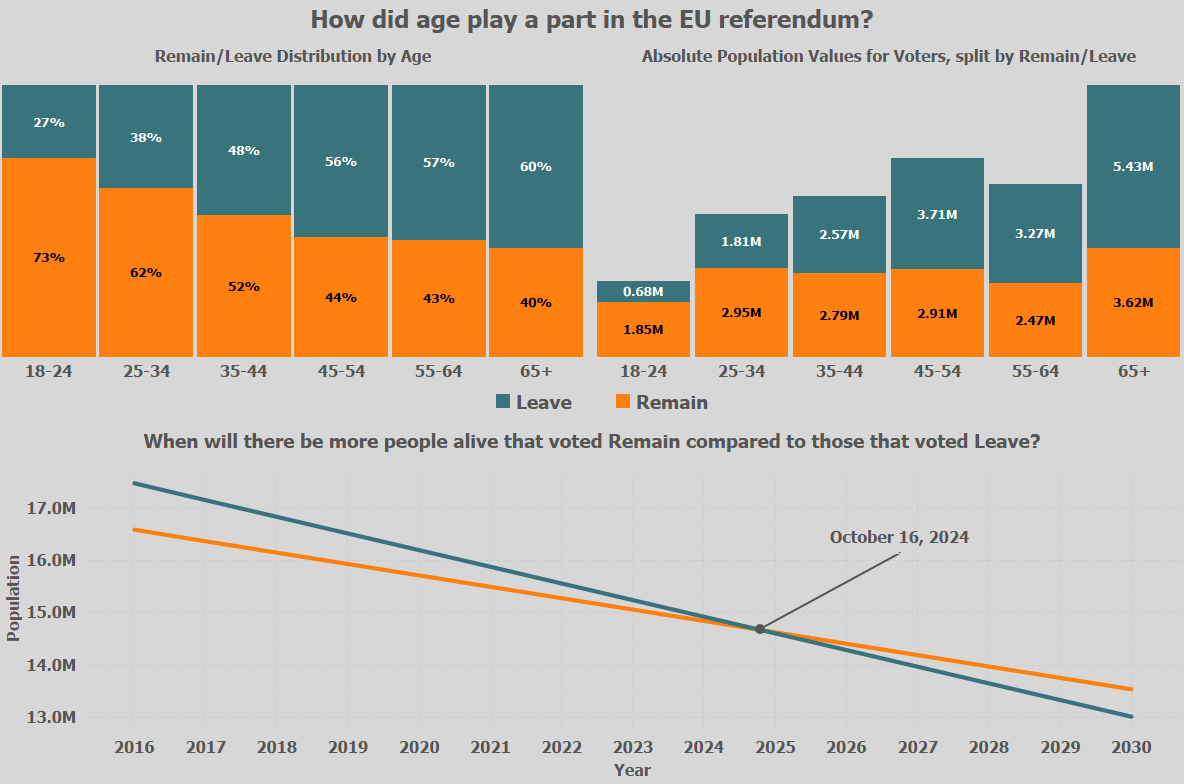
Will had the very difficult task of taking the actual polling results and determining who would be most impacted in the long-term by the decision. In other words, what part did age play in the referendum?
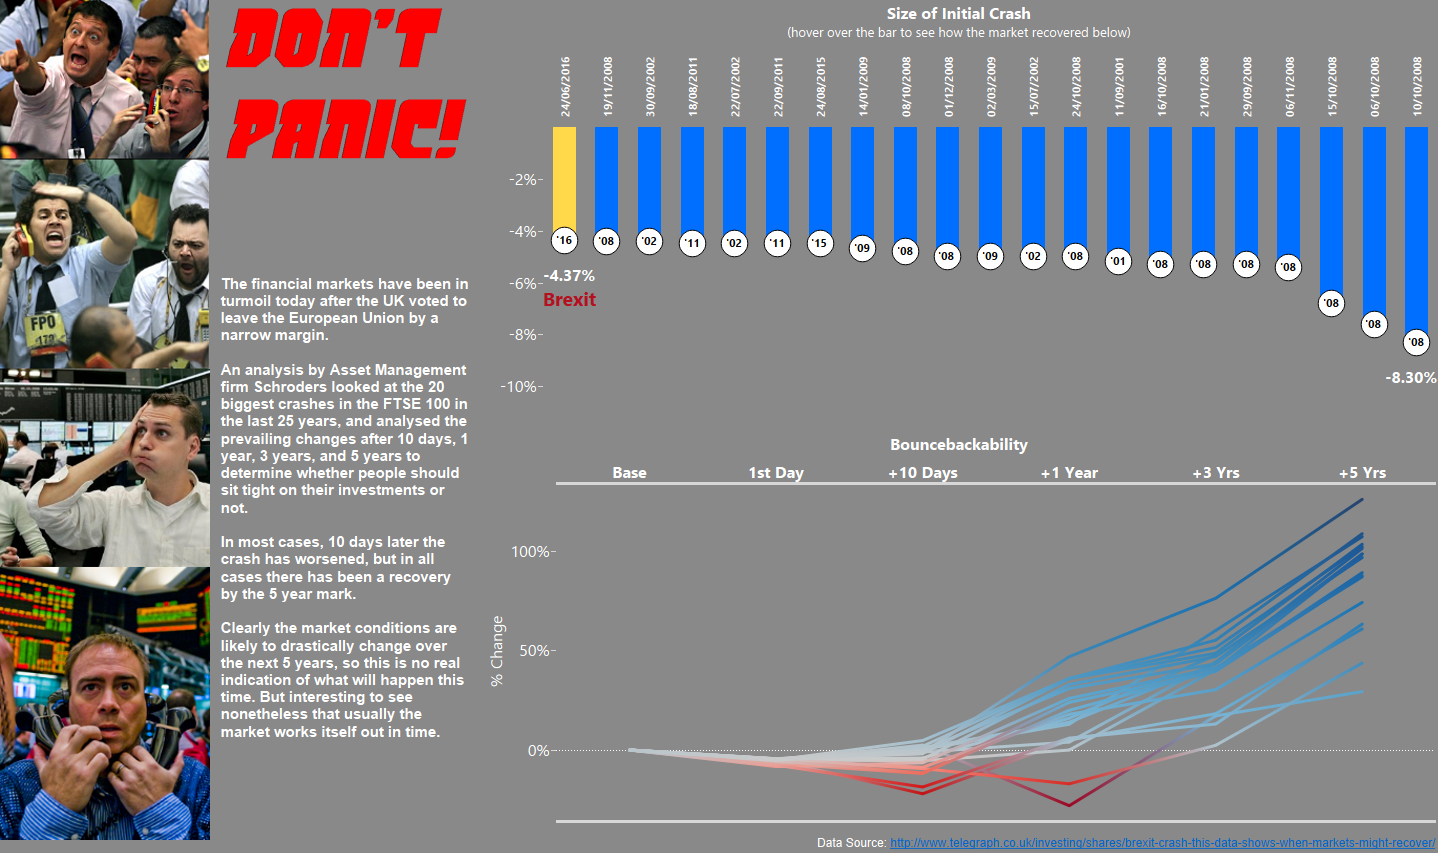
Last up was Peter, who looked at the stock market and how Brexit compares to other historical market crashes.
Overall, I think this was quite therapeutic for the team and helped us all come to grips with the complexity and magnitude of the results.