Two weeks ago, the Data School consultants wrote a tip per day for a week, which I recapped here. When they came in the following Monday morning, I threw them for another surprise. A tip a day wasn’t enough; I wanted them to create a dashboard a day, getting a total unfamiliar data set each morning. Our themes were:
- Monday – Small Data
- Tuesday – The Olympics
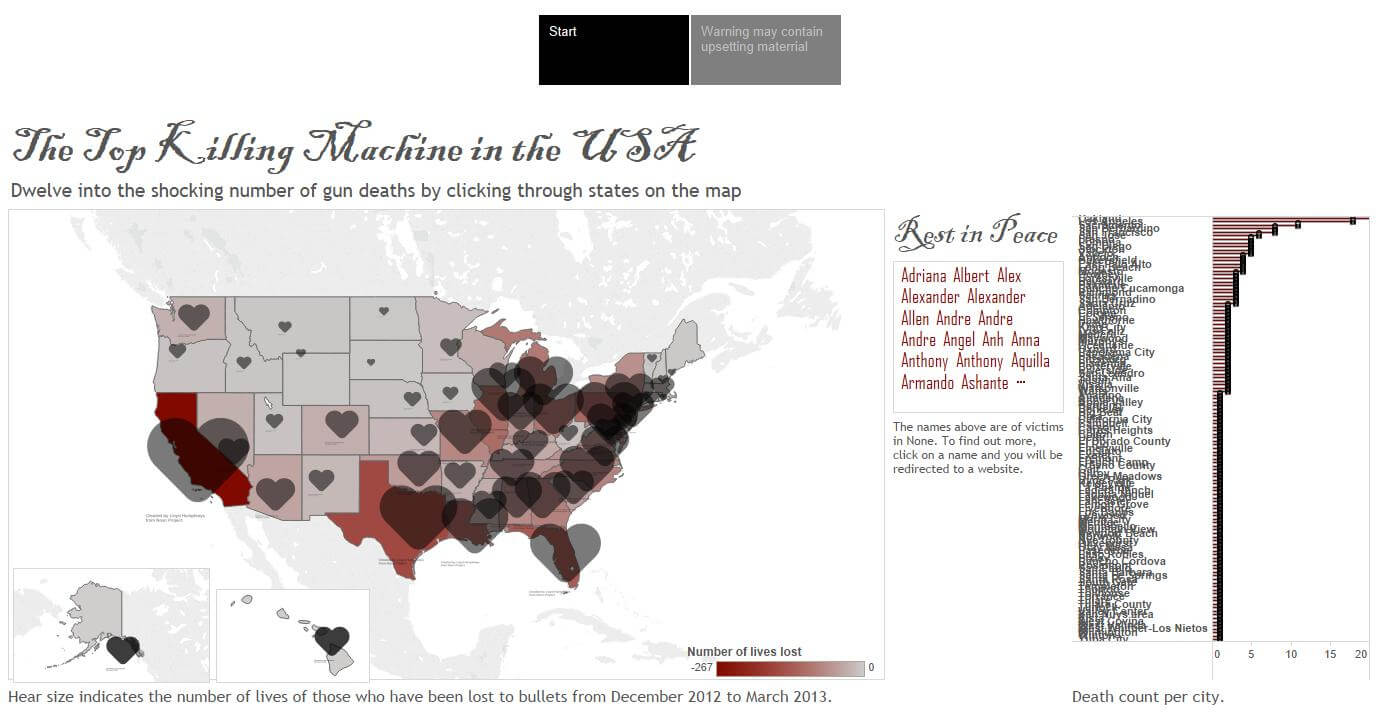
- Wednesday – Gun Deaths in the USA
- Thursday – UN Data Challenge
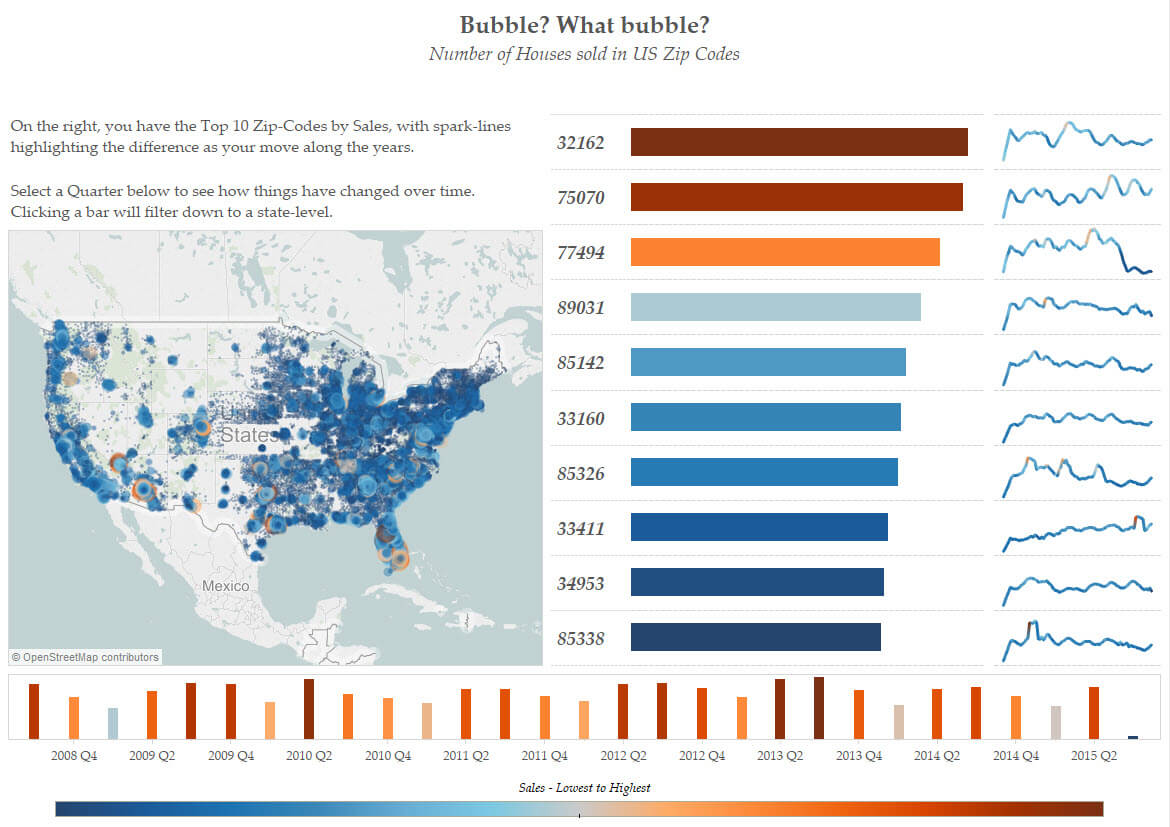
- Friday – The Real Estate Market in the USA
The pace was crazy fast, but this is all in preparation for their first client assignments, which are approaching soon. The idea is to put them under extreme pressure, particularly with timelines, so that when they start working with clients, everything will slow down. It’s my form of legalized torture.
There were so many amazing visualisations, but I forced myself to pick only one from each consultant as to the one that I thought told the best story and incorporated the best use of best practices. Click on any of the images to view their dashboard on Tableau Public.
In reverse alphabetical order…
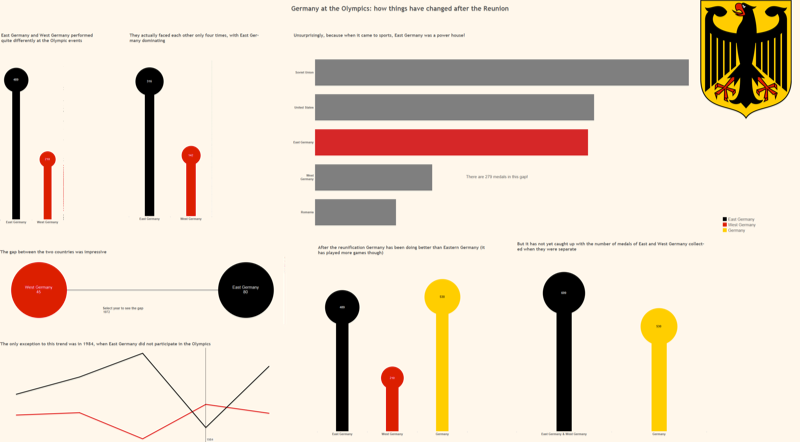
Damiana Spadafora – The Olympics (blog post)
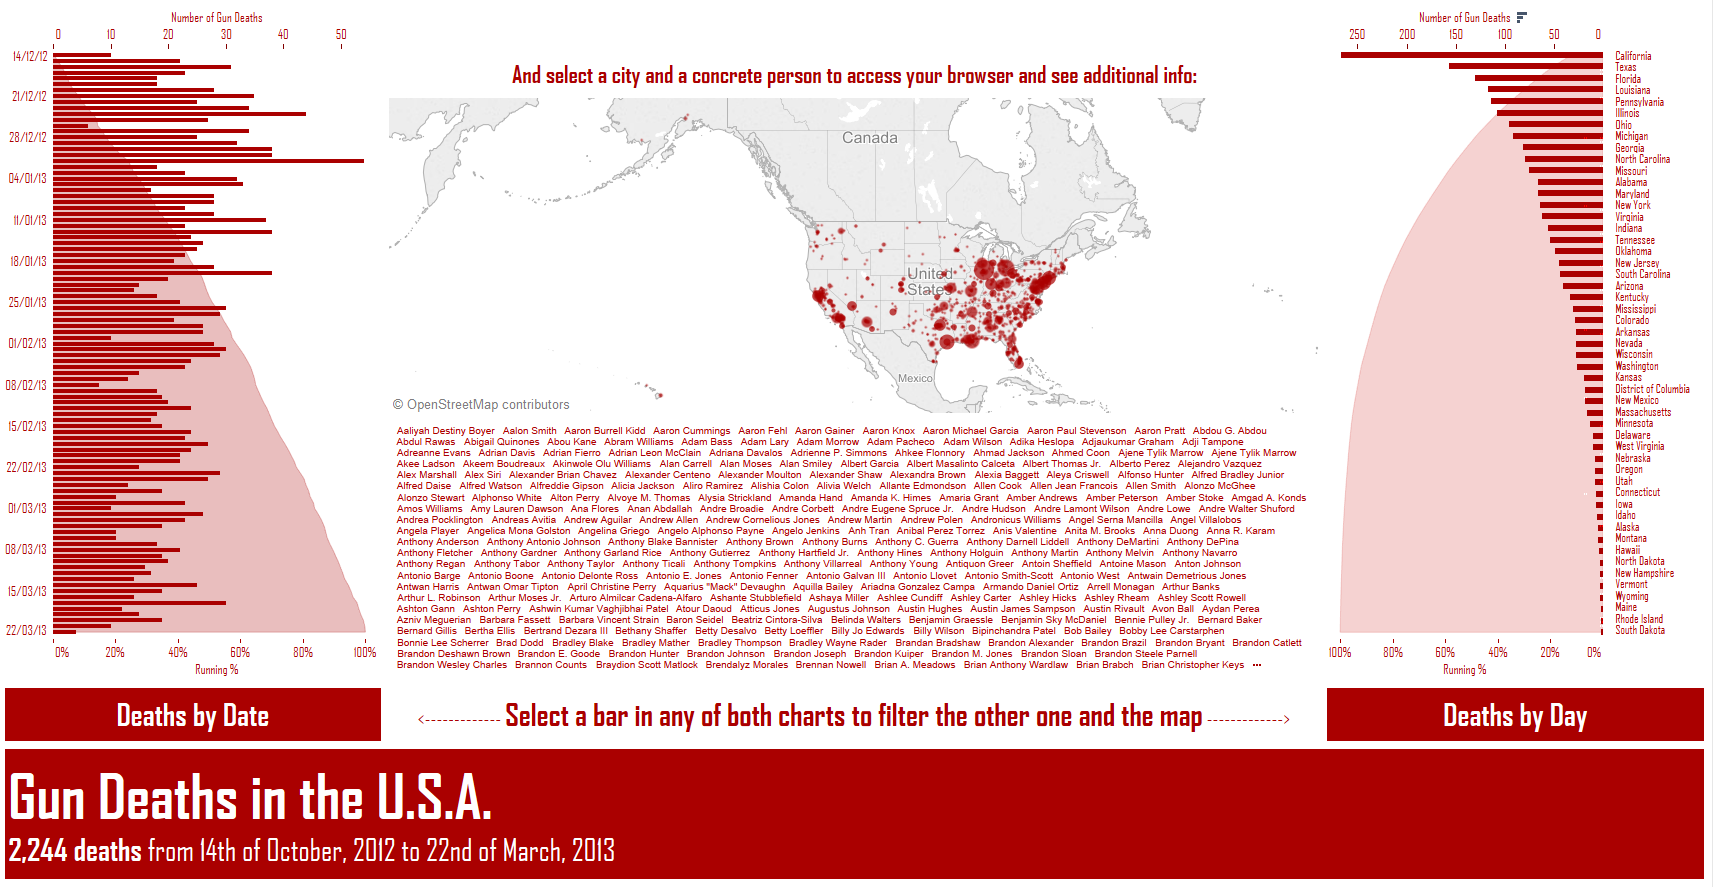
Pablo Sáenz de Tejada – Gun Deaths in the USA (blog post)
Alex Muntus – Gun Deaths in the USA (blog post)
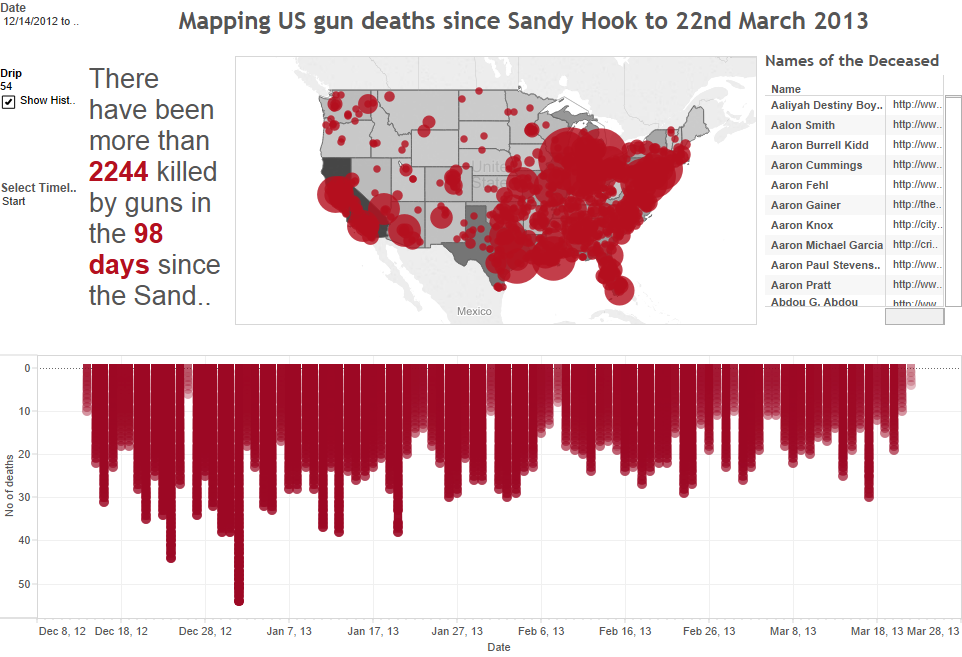
I recommend you download this workbook and hit the play button. It’s pretty dramatic.
Ravi Mistry – Real Estate in the USA (blog post)
Alexandra Hanna – Gun Deaths in the USA (blog post)
Niccolo Cirone – Exploring the Impact of “Slumification” on Development Goals (blog post)
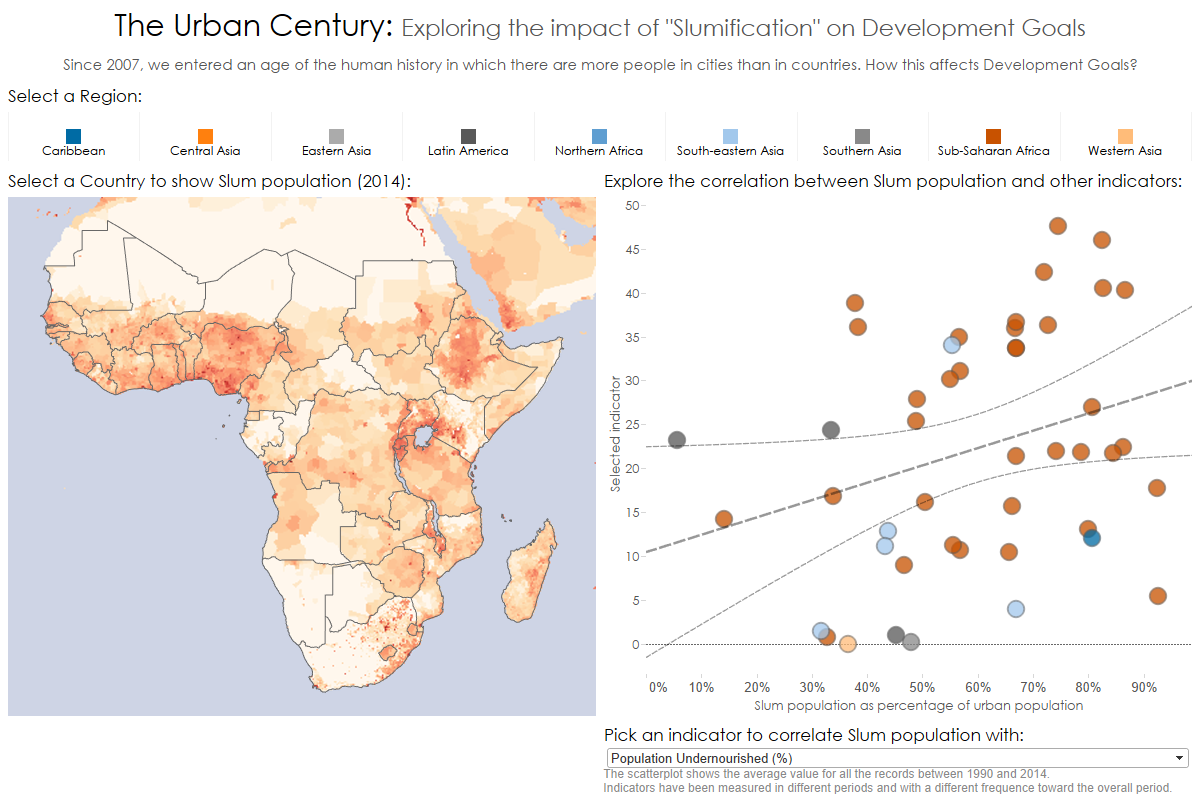
Nicco won Viz of the Day for this piece
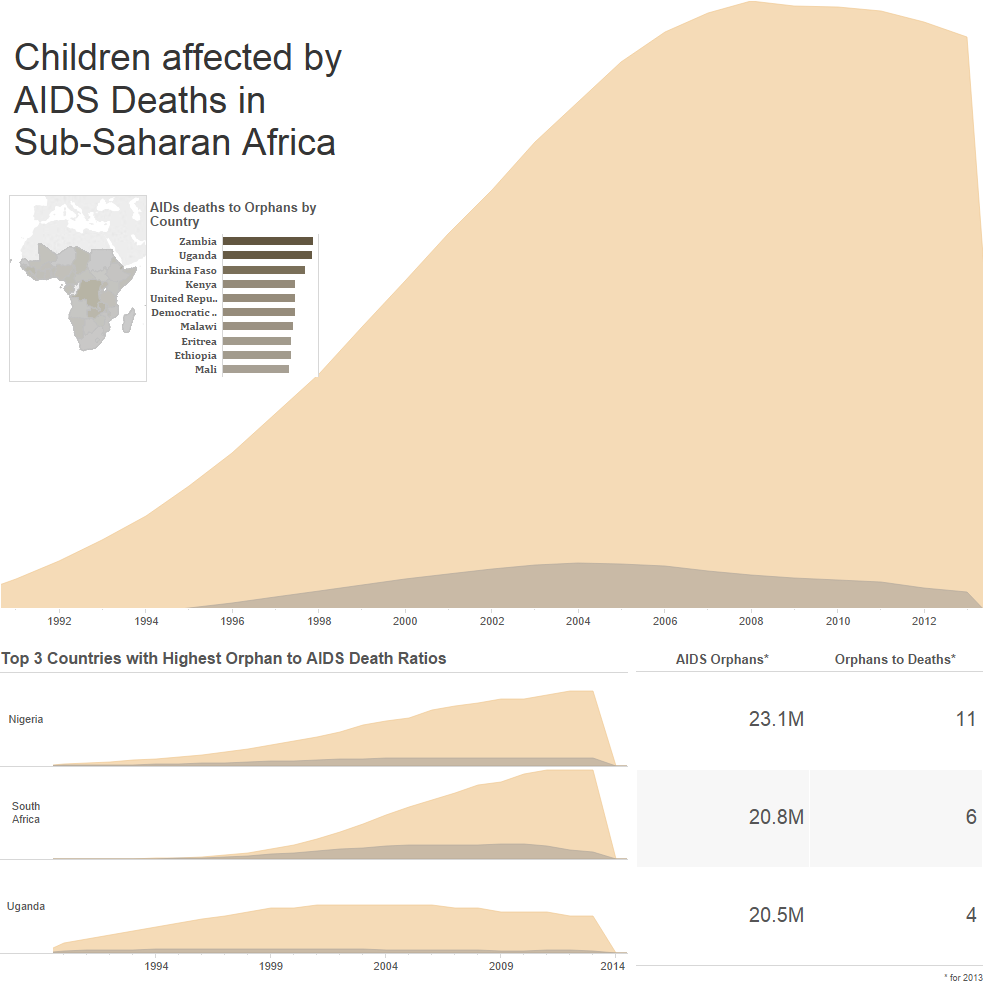
Emily Chen – Children Affected by HIV Deaths (blog post)